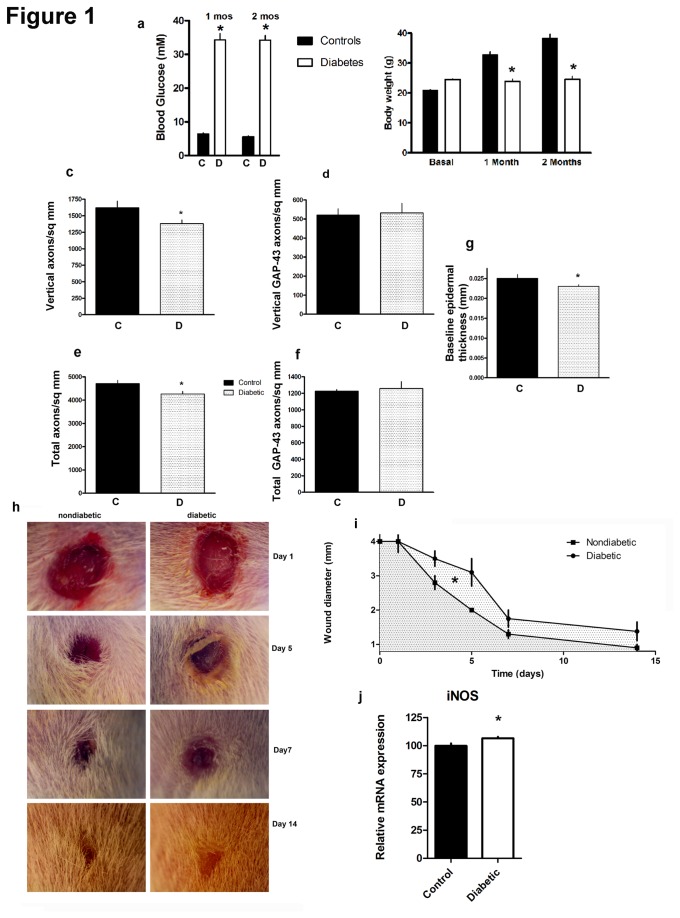
Figure 1. Diabetic mice (n=16) developed hyperglycemia (a) and gained less weight than nondiabetic mice (n=10) (b) [*p<0.0001].
Diabetic mice had fewer PGP 9.5 labelled epidermal axon profiles (c,e)[*p<0.05 for total axons; for vertical axons diabetic vs. nondiabetic p=0.04, one tailed t-test; n=5 diabetic, 5 nondiabetic] but no difference in GAP43 profiles (d,f) (n=3/group). Diabetics had a mild reduction in baseline epidermal thickness [p=0.05 one-tailed Student’s t-test; n=5/group] (g). At days 3-7 there was a slower decline of wound diameter in diabetics [*p<0.05 diabetic (35.6±3.7) vs. nondiabetic (26.6±1.1) areas under the curve and also separately for Day 5 diameter (n=5 diabetic, 5 nondiabetic )] (h,i). At 7d, there was a small rise in the mRNA expression of iNOS in diabetic mice[*p<0.05; n=4/group] (j). Note C=control nondiabetic; D=diabetic.

