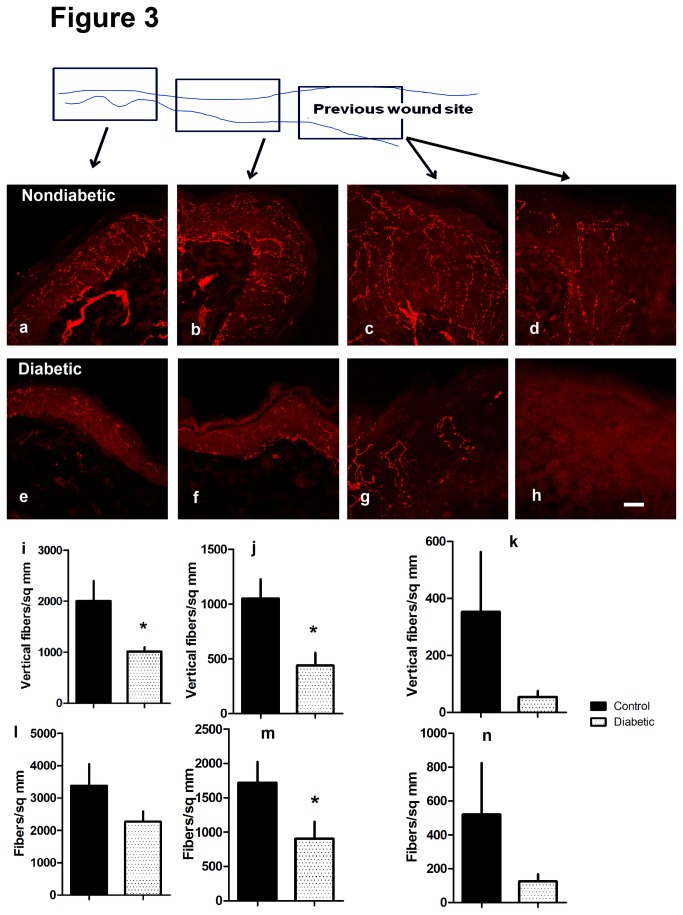
Figure 3. Innervation of three zones associated with dorsal skin wounds (black arrows) shown by the schematic to be from nearby normal skin (a,e), adjacent wound margins (b,f) and the wound zone healing by secondary intention (c,d,g,h).
Images are labeled with an antibody directed toward PGP 9.5, an axon marker. Images (a-d) are nondiabetic littermate controls and (e-h) from diabetic mice. Data are matched to the wound zone in the micrographs above them (i,l nearby normal skin; j,m adjacent wound margin; k,n wound zone). Graphs show vertically directed axon profile density (i-k) and total axon profile density (l-n) in diabetics (open bars) and nondiabetics (black bars) [i,j,m *p<0.05 diabetic vs. nondiabetic; *p<0.05 one tailed Student’s t-test diabetic vs. control; n=4 diabetic, 4 nondiabetic]. Bar=20 microns.

