
Figure 1. Clonal complex distribution of the combinations of hmbR and hpuA genes among a representative panel of English, Welsh and Northern Irish invasive serogroup B meningococcal isolates collected from 2008–2011.
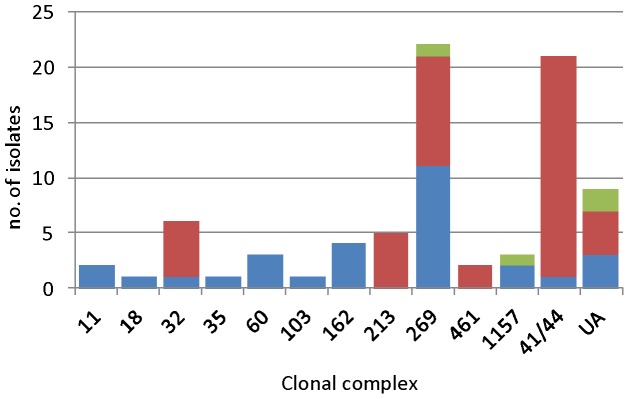
Blue bars indicate hmbR:hpuA, red bars indicate hmbR-only and green bars indicate hpuA-only. UA = unassigned STs.