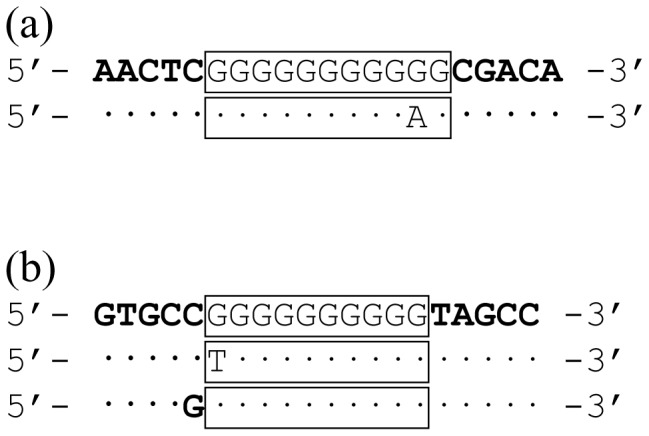
Figure 2. Sequence diversity in the homopolymeric tract regions of hmbR and hpuA.

Due to polymorphisms in the homopolymeric tract and flanking regions, the phase variation expression status could not be reliably correlated with the absolute number of consecutive G repeats (absolute tract length), rather it corresponded with an ‘effective tract length’ between defined flanking regions. In the examples provided, tracts are illustrated as pairwise nucleotide alignments in which the defined flanking regions are highlighted using bold type whilst the effective tract length is denoted by a box. Pairwise nucleotide identities are denoted by dots. For hmbR (a) the defined flanking regions were AACTC and CGACA, respectively. In the upper example the effective and absolute tract lengths are the same (11 Gs vs 11 bases). The lower tract has a G to A substitution at the second to last G giving an absolute tract length of 9 Gs whilst the effective tract length remains 11 bases. For hpuA (b) the defined flanking regions were GTGC(C/G) and TAGCC, respectively. In the upper example the effective and absolute tract length are the same (10 Gs vs 10 bases). The middle example has a G to T substitution at the first G giving an absolute tract length of 9 Gs whilst the effective tract length remains 10 bases. The lower example has a C to G substitution immediately before the prototypical tract region giving an absolute tract length of 11 Gs whilst the effective tract length remains 10 bases.
