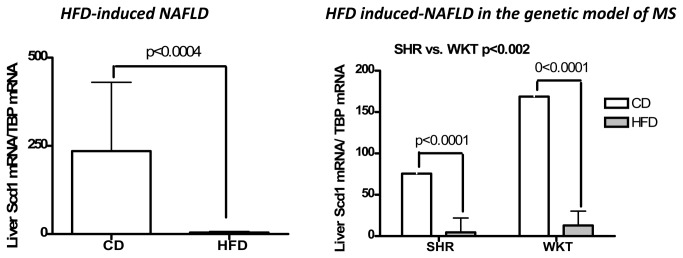
Figure 2. Analysis of liver Scd1 mRNA abundance by quantitative real-time PCR in both experimental groups.

Left panel: Each bar represents the mean ± SE values of Sprague Dawley (SD) rats randomly divided into two experimental groups (standard chow diet CD: n=10; high fat diet HFD: n=15).
Right panel: Each bar represents the mean ± SE values of SHR (n=13) and WKY (n=14) divided into two experimental groups (CD:SHR, n= 6 and WKY, n=7; HFD: SHR, n=7 and WKY, n=7). The statistical significance of SHR vs. WKY indicates the comparison between strains independent of diet by two-way ANOVA.
In each sample, the Scd1 expression was normalized by the expression of Tbp (TATA box binding protein).
