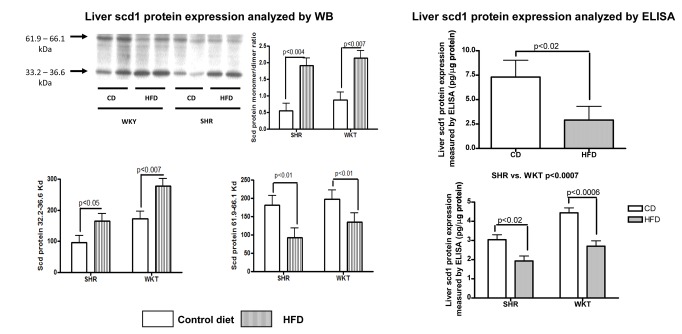
Figure 3. Analysis of liver Scd1 protein expression by Western blot and ELISA.
Upper left panel: Representative analysis of liver Scd1 protein levels in each experimental model (SHR or WKY) with beta-actin as loading control. Upper right panel: Densitometric quantification of liver SCD1 monomer/dimer ratio protein levels. Values are means ± SE for 13 animals in the SHR group and 14 in the WKY group according to diet, as explained in the legends for Figures 1 and 2. Lower left and right panels: Densitometric quantification of the liver Scd1 monomeric and dimeric band, respectively, in each experimental group according to diet.
Liver scd1 protein expression measured by ELISA.
Upper right panel: HFD-induced NAFLD: Each bar represents the mean ± SE values of SD rats randomly divided into two experimental groups (CD: n=10; HFD: n=15).
Lower right panel: Each bar represents the mean ± SE values of SHR and WKY divided into two experimental groups (CD:SHR, n= 6 and WKY, n=7; HFD: SHR, n=7 and WKY, n=7). Results are expressed pg/µl proteins.

