
Figure 3. Distance convergence toward Tag Challenge cities of web hits on http://www.tag-challenge.com.

We consider a moving average of distance filtered daily tweet traffic (MA(prop (t))
(t)) ) (grey circles), which is fit with a linear regression (red line) giving a correlation of
 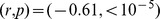 .
.