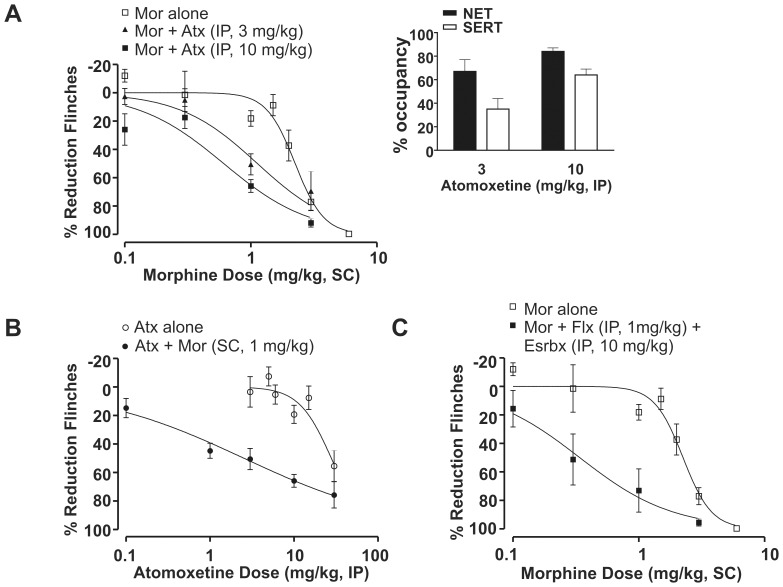
Figure 2. Atomoxetine exhibited antinociceptive synergy with morphine using a fixed-dose design in the rat formalin model.
(A) Both 3 and 10 mg/kg atomoxetine (Atx, IP) shifted the morphine (Mor) dose-response curve leftward in the rat formalin model (n = 6–16). Morphine alone: ED50 = 2.3 mg/kg (95% CI: 2.0–2.5); morphine+atomoxetine (IP, 3 mg/kg): ED50 = 1.1 mg/kg (95% CI: 0.8–1.6); and morphine+atomoxetine (IP, 10 mg/kg): ED50 = 0.6 mg/kg (95% CI: 0.4–0.8). All data points are shown as mean ± SEM for each group and are expressed as percentage of controls. Inset (A) Atomoxetine (IP) at 3 and 10 mg/kg was associated with 67±10% and 84±3% for NET and 35±9% and 64±5% for SERT occupancy measured ex vivo at 75 min post-dose, respectively. All occupancy data represent mean (± SEM) for each group. (B) A subefficacious dose of morphine 1 mg/kg (SC) left-shifted the atomoxetine dose-response curve (n = 6–16). Atomoxetine alone: ED50 = 27.8 mg/kg (95% CI: 22–36); and atomoxetine+morphine (SC, 1 mg/kg): ED50 = 2.5 mg/kg (95% CI: 1.3–4.7). (C) A fixed combination of NET selective inhibitor esreboxetine (Esrbx, IP, 10 mg/kg) and SERT selective inhibitor fluoxetine (Flx, IP, 1 mg/kg) left-shifted the morphine dose-response curve (n = 6–12). Morphine alone: ED50 = 2.3 mg/kg (95% CI: 2.0–2.5); morphine+esreboxetine (IP, 10 mg/kg)+fluoxetine (IP, 1 mg/kg): ED50 = 0.3 mg/kg (95% CI: 0.2–0.7).

