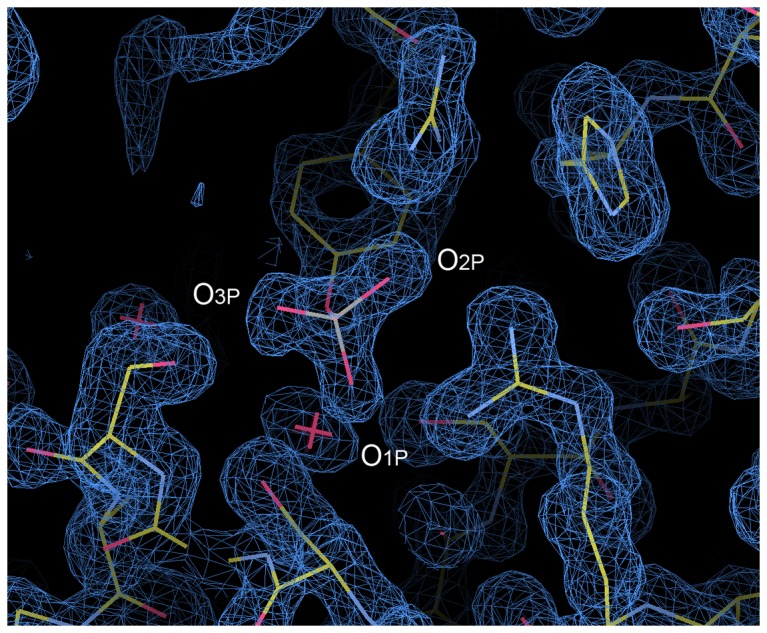
Figure 4. The 2Fo–Fc map around the phosphate group of the phosphotyrosine residue, pTyr191pep.

The contour level is set to 1.2 σ, where σ is the root-mean-square deviation of the electron density.

The contour level is set to 1.2 σ, where σ is the root-mean-square deviation of the electron density.