
Figure 4. The 2Fo–Fc map around the phosphate group of the phosphotyrosine residue, pTyr191pep.
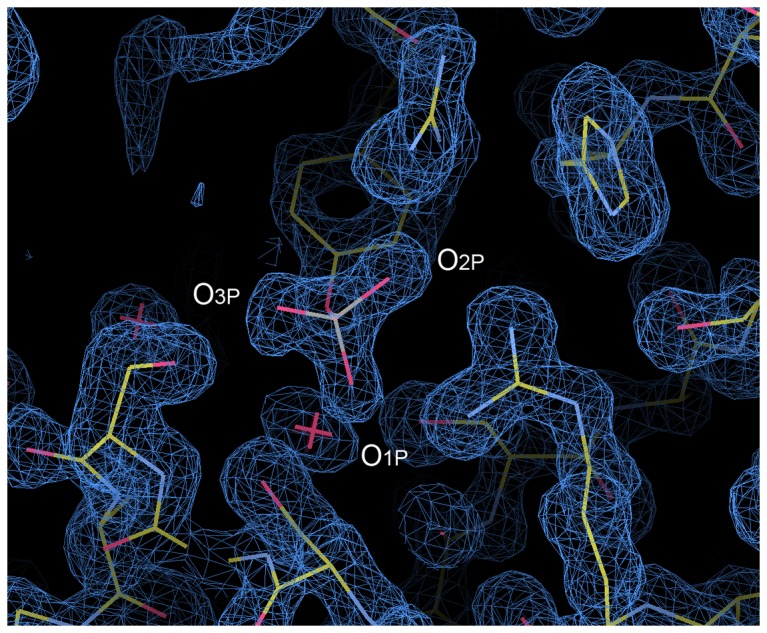
The contour level is set to 1.2 σ, where σ is the root-mean-square deviation of the electron density.
Official websites use .gov
A
.gov website belongs to an official
government organization in the United States.
Secure .gov websites use HTTPS
A lock (
) or https:// means you've safely
connected to the .gov website. Share sensitive
information only on official, secure websites.
The contour level is set to 1.2 σ, where σ is the root-mean-square deviation of the electron density.