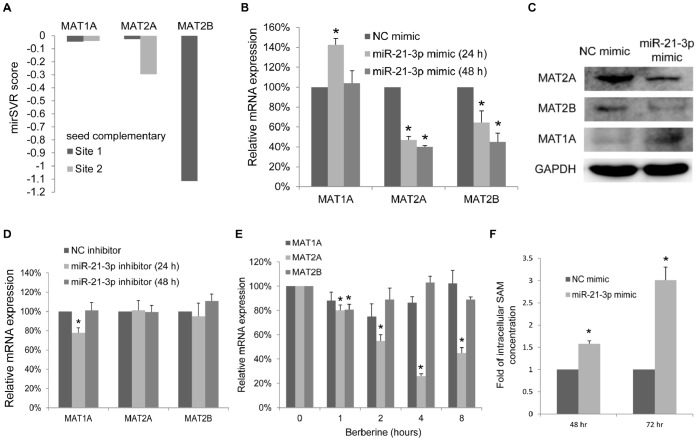
Figure 4. MicroRNA-21-3p and berberine induce differential changes in MAT expression and miR-21-3p up-regulates SAM contents.
(A) The histogram shows the mirSVR score of each seed complementary site in the 3′ UTRs of MAT1A, MAT2A, and MAT2B. (B) The relative mRNA expression levels of MAT1A, MAT2A, and MAT2B in HepG2 cells were measured using a qRT-PCR by comparing the transfection of 50 nM of miR-21-3p mimics and negative-control (NC) mimics for 24 h and 48 h. Data are presented as the mean ± standard error of 3 independent experiments. (C) Western blot analysis showing the protein levels of MAT2A, MAT2B and MAT1A after the transfection of 50 nM of miR-21-3p mimics or negative-control mimics for 72 h. GAPDH was used as the loading control. (D) The relative mRNA expression levels of MAT1A, MAT2A, and MAT2B in HepG2 cells were measured using a qRT-PCR by comparing the transfection of 100 nM of miR-21-3p inhibitors and negative-control inhibitors for 24 h and 48 h. Data are presented as the mean ± standard error of 3 independent experiments. (E) The HepG2 cells stimulated by the time course of 40-µM berberine treatment for up to 8 h compared with the untreated control. The relative mRNA expression levels of MAT1A, MAT2A, and MAT2B were measured using a qRT-PCR. (F) After 50 nM of miR-21-3p mimics or negative-control mimics transfection for 72 h, the intracellular SAM concentration of the HepG2 cells was quantified. The SAM levels were expressed as a fold expression. Data are presented as the mean ± standard error of 3 independent experiments. “*” indicates a significant difference with P<0.05.

