
Figure 2. Levels of serum VEGF and sFlt-1 in RSA patients and normal pregnancy women.
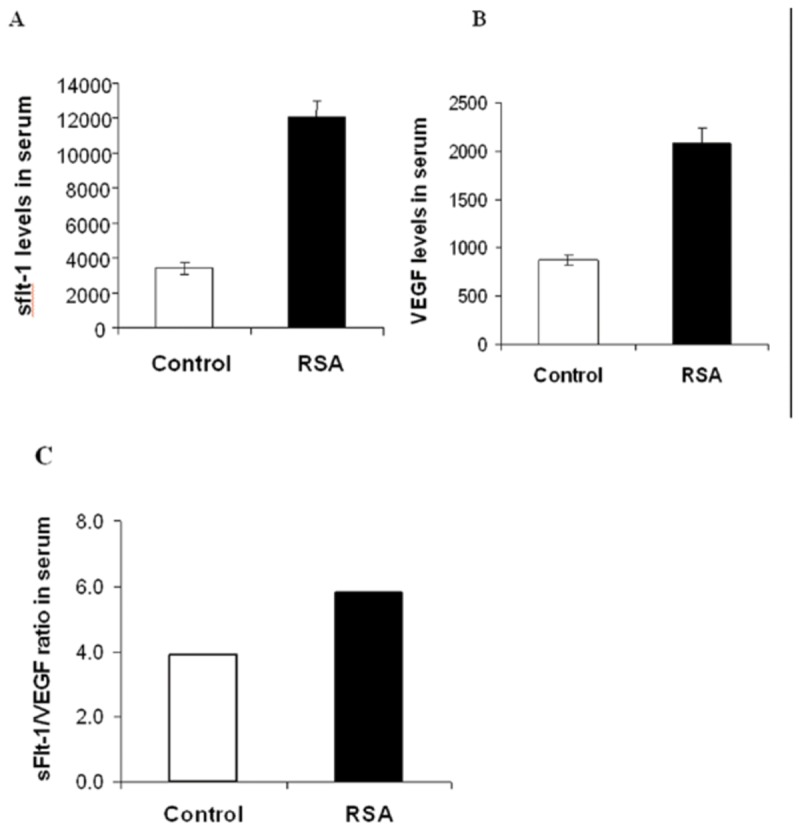
(A) The levels of sFlt-1 in the RSA group were significantly higher than in the control group (p<0.0001). (B) The levels of VEGF in the RSA group were significantly higher than in the control group (p<0.0001). (C) The ratio of sFlt-1/VEGF in serum.