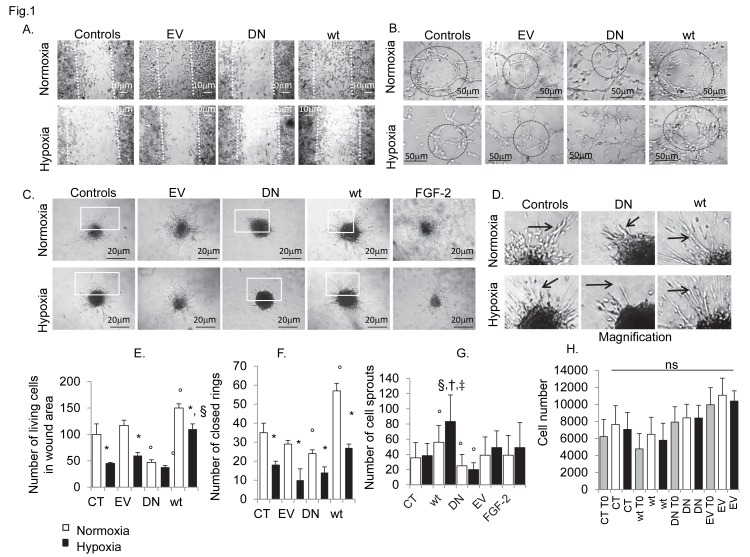
Figure 1. Consequences of hypoxia and Cdk5 deregulation on in vitro hBMECs angiogenesis.
Phase contrast images showing the impact of hypoxia (24h 1% O2) and Cdk5 deregulation on cell migration (A), capillary tube formation (B) and spheroid cell sprouting (C). Assays were performed during 24h of hypoxia and/or normoxia-control condition, in stable hBMECs transfectants expressing Cdk5 wild-type (Cdk5-wt) and Cdk5 kinase inactive mutant Cdk5-(DN). Empty Vector (EV) transfectants served as negative controls of transfection. Hypoxia almost completely inhibited in vitro angiogenesis in hBMECs, as seen by the reduction in cell migration from scratched monolayer (A), tubule like structure formation (B) and/or cell sprouting (C). In normoxia, Cdk5-wt overexpression showed increased cell migration (A) and tubule formation (B), with an irregular formation of cell sprouts (C and D, arrows in magnification) which appeared more thin and disorganized, respect the controls. In contrast, Cdk5 kinase mutants (DN) were not able to migrate (A), to form new capillary structures (B) or sprouts (C, arrows in D). (G) The number of cell sprouts was markedly reduced. (A) Notably, in vitro angiogenesis was rescued in Cdk5-wt transfectants during hypoxia. (H) MTS assay was used to show the exclusion of other effects of hypoxia and transfection on cell proliferation. Calculated results are reported in graphs: E, number of living cells in wound area; F, number of closed capillary rings; G, number of cell sprouts; H, MTS assay showing cell proliferation in normoxic and hypoxic conditions, respectively. Data are expressed as mean ±SD of biological triplicates. * P <0.05 vs normoxia associated cell type, ° P <0.05 vs CT normoxia, † P <0.05 vs wt normoxia, § P <0.05 vs CT hypoxia, and ‡ P<0.01vs DN hypoxia; P value calculated using the Student t test. Bars in panel A, 10 µm. Each experiment was performed in triplicate.

