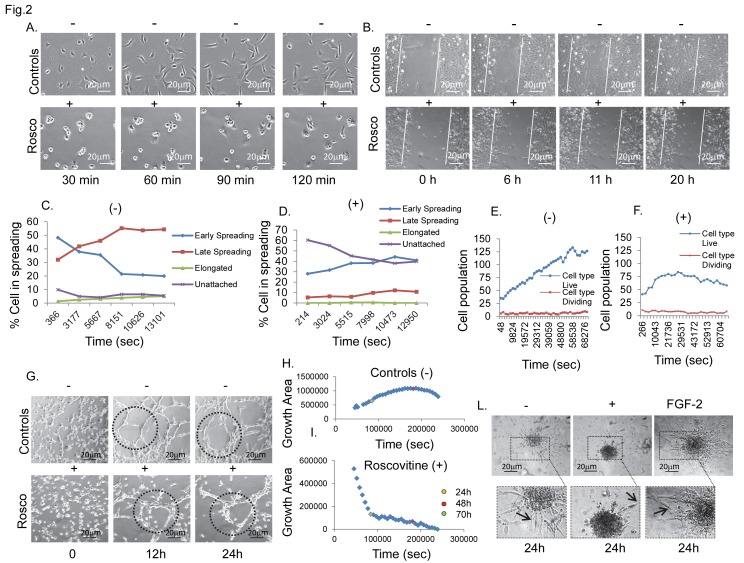
Figure 2. Cdk5 kinase activity is required for in vitro hBMECs angiogenesis.
Figure shows phase contrast images of in vivo time course analysis of cell spreading (A), cell migration (B), and the formation of tubule like structure in roscovitine (50 µM) treated (+) and untreated (-) cells (G). Graphs C and D report the computational analysis of the characterization of cell typologies during the progression of different phases of cell spreading in controls (C) and roscovitine treated cells (D), determined using AnalyserTM software. Compared to the controls (C), roscovitine (D) inhibited cell elongation and increased the time dependent cell distribution between early and late spreading. Graphs E and F show the number of living and dividing cells presents in the wounded monolayer area in controls (E) and with roscovitine treatment (F) determined using AnalyserTM software. (G) Representative time-lapse images showing the progression of tubule formation throughout the time course, in controls and in treated cells. Graphs H and I, show the relative quantitative evaluation of growth area in controls (H) and treated cells (I), determined by AnalyserTM software. (I) Roscovitine reduced the growth area after 10h, mainly destabilizing neo-forming cell junctions and integrating cell networks. (L) Representative images showing the inhibitory effect of roscovitine on sprout formation, compared to controls (-) and FGF-2 stimulated cells (positive control). The phase contrast images have been acquired as z-stacks and with automated focusing. Bars, 20 µm. Original magnification in L, x 200. Each experiment was performed in triplicate.

