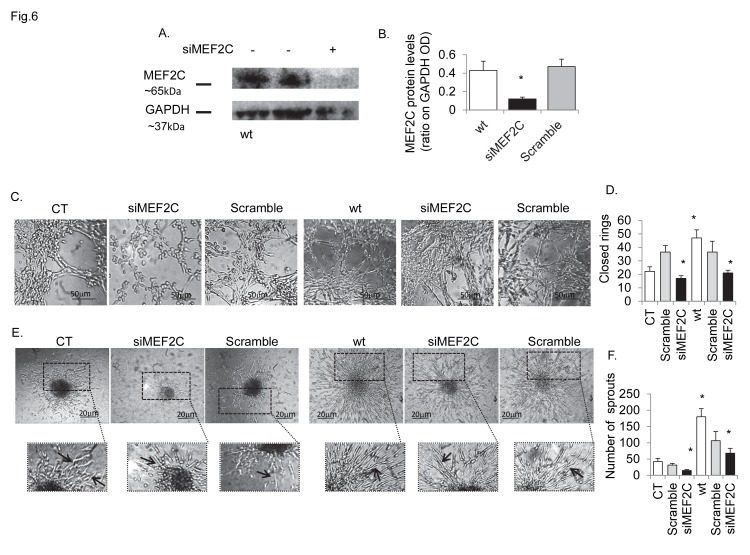
Figure 6. Cdk5 and MEF2C promote proper spatial organization of brain endothelial cells.
Figure shows the effect of MEF2C knock down, using siRNAs on angiogenesis in control cells (CT) and Cdk5-wt transfectants (wt). Scrambled siRNA has been used as negative controls. (A) Western blot analysis showing the effect of siRNA on MEF2C protein levels in wt cells. (B) siRNA reduced MEF2C protein expression by approximately 80%. (C) Tubule network (24h) was inhibited in control cells, while appeared more structured in Cdk5-wt transfectants. Nonetheless, the number of complete closed rings (D) was significantly reduced in both controls and Cdk5-wt transfectants as the spheroid sprout length and thickness (E) or sprouts number (F). Calculated results are reported in graphs: B, MEF2C protein levels (as ration on GAPDH OD) in wt and siMEF2C, or scrambled wt transfected cells; D, number of closed capillary ring structure determined on Matrigel® assay; F, number of cell sprouts determined in spheroid assay. Data are expressed as mean ± SD of biological triplicates. For all figures * P <0.05 vs controls. P value calculated using the Student t test. Phase contrast images; bars, 20 µm; bars in panel C, 50 µm. Experiments were performed in triplicate.

