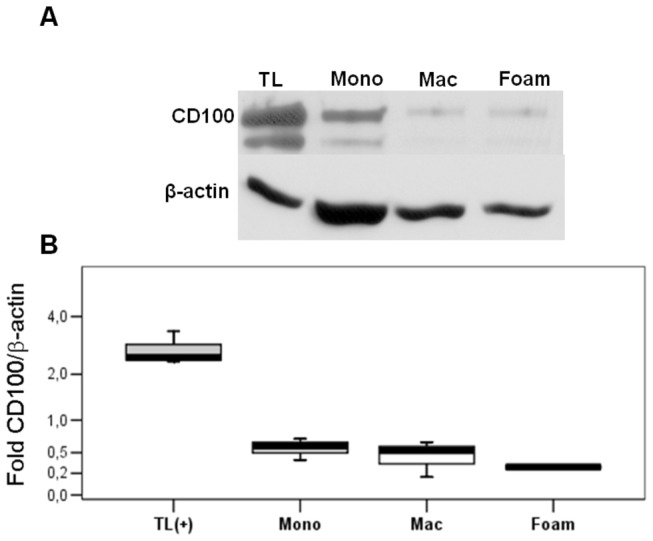
Figure 6. Cultured monocytes express higher amounts of CD100 protein than in vitro differentiated macrophages and foam cells.

CD100 and β-actin protein expression was evaluated in activated T lymphocytes (TL – positive control) and PB monocytes (Mono), macrophages (Mac) and foam cells (Foam) A. Western blot showing CD100 and β-actin bands B. Densitometry of CD100 (sum of 120 and 150kDa bands) and β-actin protein bands, showing CD100/β-actin. Mean ± SD of 3 independent experiments.
