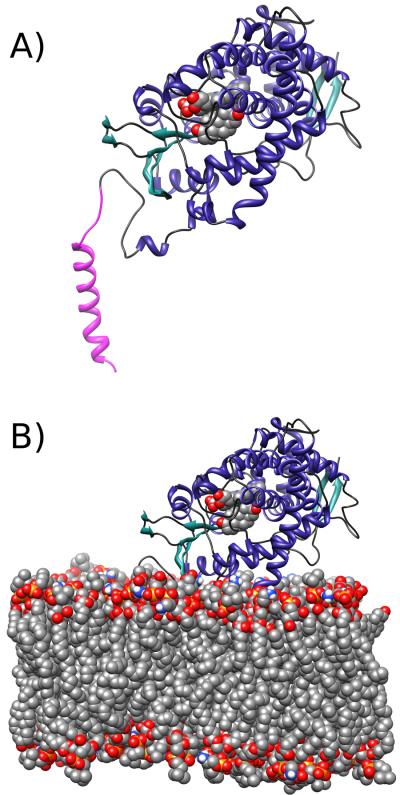
Figure 1.
Depiction of the simulated systems. A) The protein, heme, and ligand assembly. B) Illustration of the orientation of aromatase with respect to the bilayer, with the explicit lipid bilayer model shown, constructed as described in the methods. The depicted system in the illustration is from simulations of aromatase with a protonated Asp-309 residue, and the modeled transmembrane domain is colored in magenta.

