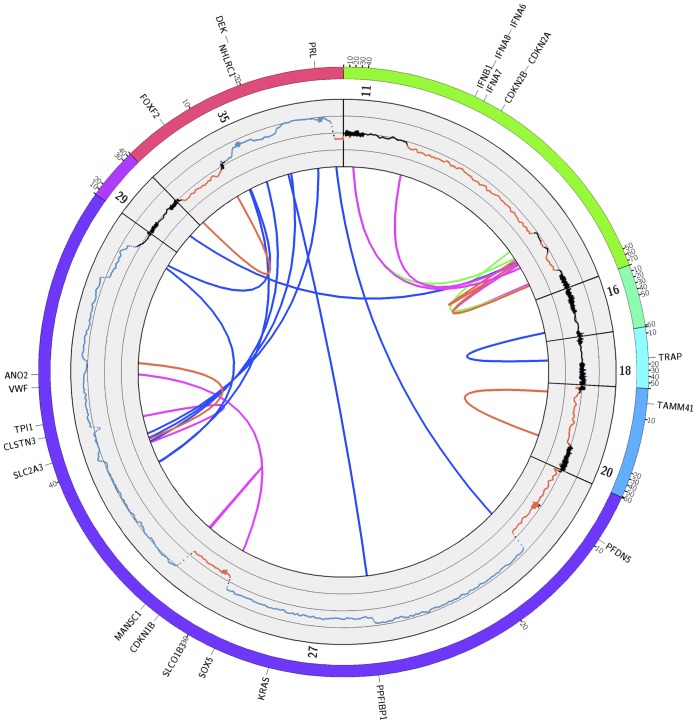
Figure 2. Structural aberrations detected in the genome of tumor T49.
The outer track represents chromosomes with detected aberrations, with each tick indicating 10-number profile and the rearrangements identified by PEM analysis. The inner track displays log2 ratios as obtained by DOC analysis. The y-axis spans from −4 to 4 with sub-scales at −2 and 2. Arcs indicate the rearrangements detected by PEM analysis. Blue = translocations, red = deletions, green = duplications, magenta = inversions. For better visibility regions with rearrangements are expanded. Canine RefSeq genes affected by aberrations and/or copy-number imbalances are indicated.

