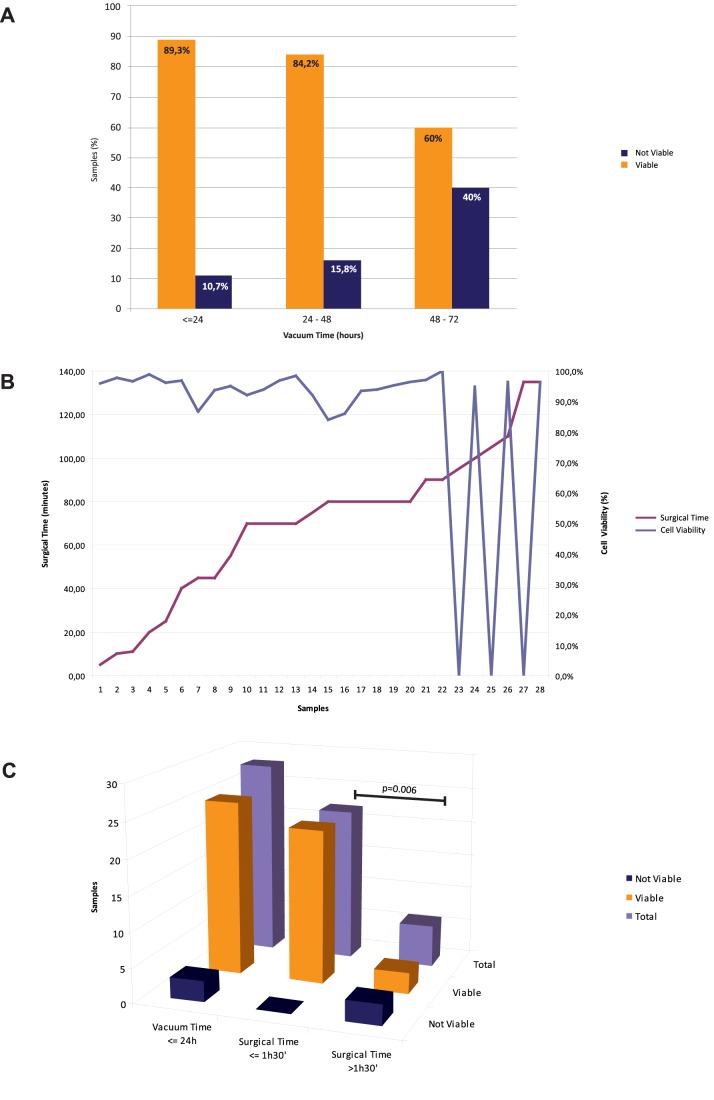
Figure 2. Reciprocal relationship between surgical and VPAC times with cell viability.
A: cell viability was 89.3% in specimens with VPAC ≤24 h, 84.2% in specimens with 24 h<VPAC≤48 h and 60% in specimens with VPAC >48 h. B: The critical surgical time was set around 1 hour and 30 minutes, as shown by the drop of cell viability line as compared to the surgical time. This analysis was performed in the subset of specimens with VPAC time ≤24 h (in order not to introduce a bias due to long cold ischemia time). C: Assessment of cell viability in specimens with VPAC time ≤24 h and comparison with surgical time. The histogram shows the number of viable and not viable cell cultures obtained from samples with a VPAC time ≤24 h: total number of specimens with VPAC time ≤24 h on the left, specimens with VPAC time ≤24 h and surgical time ≤1 hour and 30 minutes in the middle, specimens with VPAC time ≤24 h and surgical time >1 hour and 30 minutes on the right. The difference in cell viability between the two groups (surgical time <1 hour and 30 minutes and surgical time >1 hour and 30 minutes) was statistically significant (p = 0.006, Fisher’s exact test).

