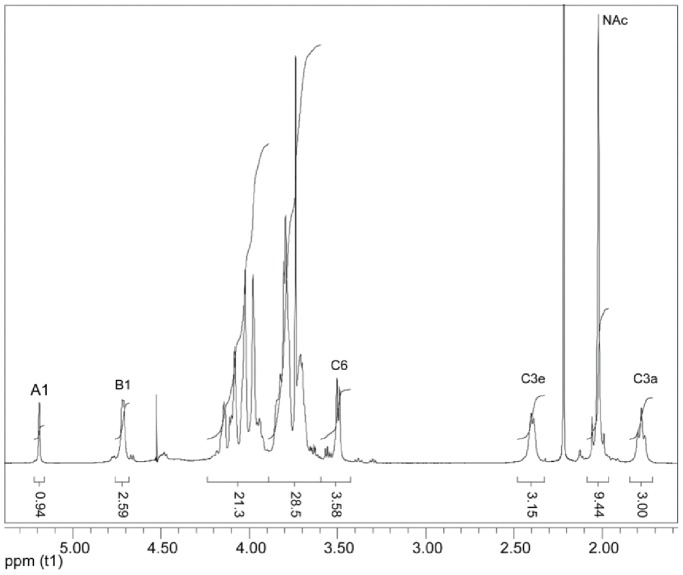
Figure 2. 1-D proton NMR spectrum of the polysaccharide.
The integration values show the relative molar ratio of the two polysaccharides, Am and (B–C)n of about 1∶3. For numbering, see Table 3 (C3e and C3a designate the equatorial and axial proton, respectively, of the C-3 methylene group).

