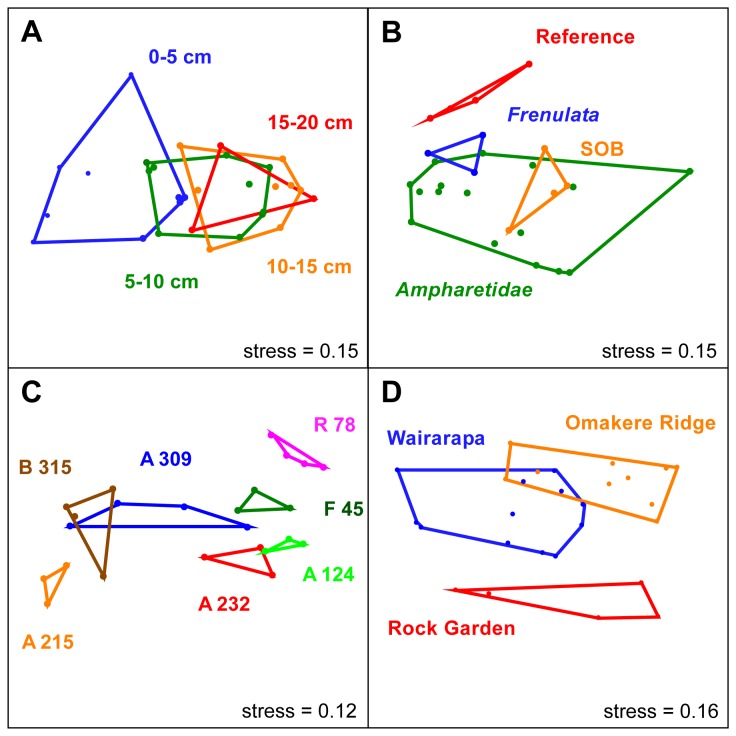
Figure 6. NMDS ordination plots.
3D-NMDS ordination plots, shown as 2D graphs (other axes are not shown), visualizing the ARISA dataset. The subgroups that were analyzed for each condition are depicted as colored polygons. A: Ordination plot of investigated depth layers. ANOSIM was used to test whether the layers are significantly different. Layer 1 (0-5 cm) was different from layer 2 (5-10 cm; R1/2 = 0.28, p1/2 = 0.013) and layer 3 (R1/3 = 0.6, p1/3 = 0.001). Layer 2 and 3 were not significantly different. We excluded the deepest layer due to its insufficient number of data points. B: Ordination plot of seep-associated microbial or faunal communities. ANOSIM was not performed, due to unequal group sizes. C: Ordination plot of sampling sites. A: Ampharetidae, B:SOB, F: Frenulata, R: Reference. Dissimilarity of the sites is supported by an R value of 0.48 (p <0.001). A 157 and A 258, as well as the bottom layers (15-20 cm) of site R 78, A 309 and B 315 were excluded from the ANOSIM to ensure equal group sizes. D: Ordination plot of the sampling areas Omakere Ridge (OR), Wairarapa (W) and Rock Garden (RG). The overall differences between the sampling areas are supported by an ANOSIM R value of 0.542 (p<0.001). R and p values comparing the seep areas are as follows. RRG/OR = 0.7 (p<0.001); RRG/W = 0.64 (p<0.001), RW/OR = 0.39(p<0.001).

