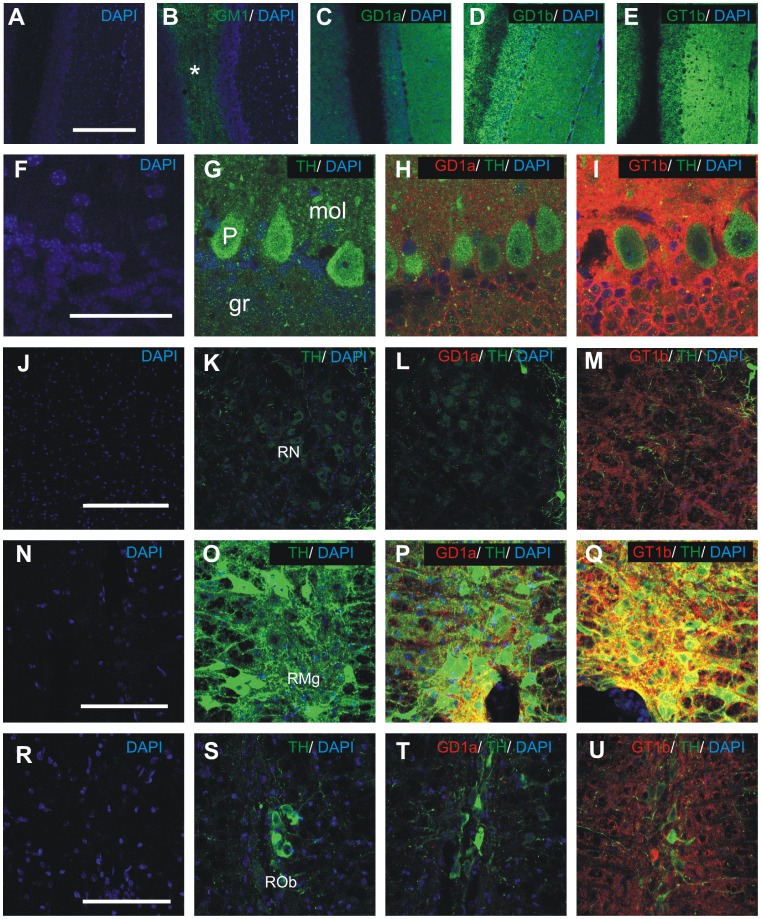
Figure 5. The expression of major brain gangliosides in coronal sections of mouse cerebellum (A-I), red nucleus (J-M) and raphe nuclei (N-U).
Distribution of gangliosides GM1 (B, green, asterix denotes the white matter of cerebellum), GD1a (C, green), GD1b (D, green) and GT1b (E, green) in mouse cerebellum (low magnification). Double immunohistochemistry on GD1a (H, L, P, T; red) or GT1b (I, M, Q, U; red) and TH (G, H, I, K, L, M, O, P, Q, S, T, U; green) in cerebellum (F-I), red nucleus (J-M), raphe magnus nucleus (N-Q) and raphe obscurus nucleus (R-U). The negative controls were performed by omitting the anti-ganglioside antibody (A, G, K, O, S) or both anti-ganglioside and anti-TH antibody (F, J, N, R). Cell nuclei are stained blue using DAPI. gr, granular cell layer; mol, molecular layer; P, Purkinje cell layer; RMg, raphe magnus; RN, red nucleus; ROb, raphe obscurus. Scale bars = 200 µm in A-E, J-M; 50 µm in F-I and 100 µm in N-U.

