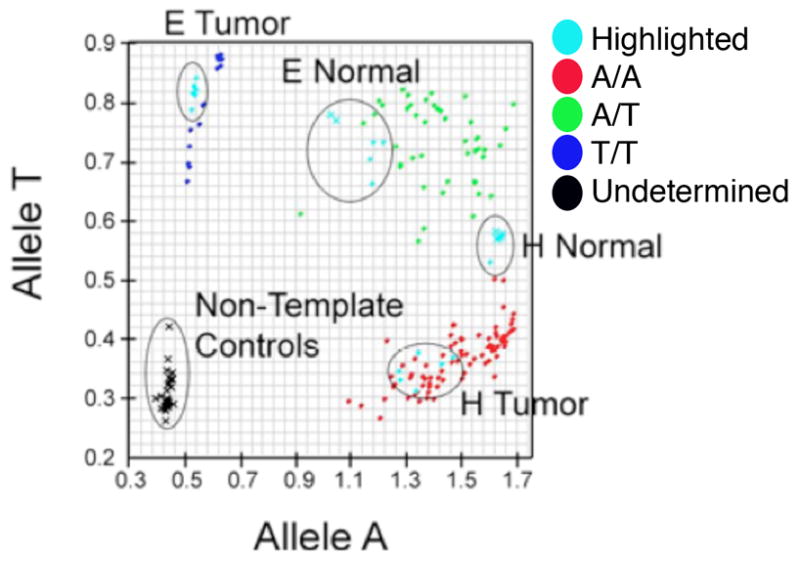
Figure 7. Loss of Heterozygosity of NF1 in Radiation-Induced Breast Cancers.

Taqman SNP Genotyping of rs9902893. Allelic Discrimination plot was generated by Applied Biosystems software SDS 3.0, which assigns genotypes A/A (blue), A/G (green), or G/G (red). VIC and FAM fluorescence in each well was recorded and plotted (VIC on y-axis, FAM on x-axis), corresponding to Allele A and Allele G, respectively. Samples were run in replicates of 6, and each replicate is plotted. Black indicates that genotype cannot be determined. Controls were circled, and samples showing LOH are highlighted in blue, circled, and labeled.
