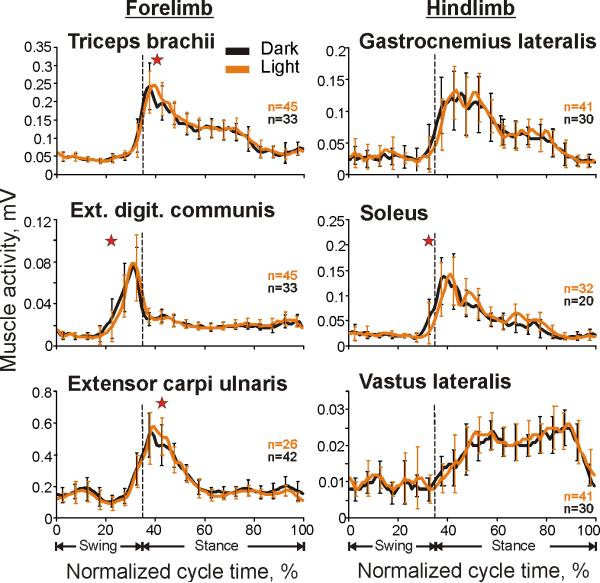
Figure 5.
Typical examples of EMG activity of selected limb muscles during locomotion in the darkness and light. Each panel shows a representative activity of a muscle, which was averaged over 20-45 strides of each locomotion task, all recorded during one session (see Methods for stride selection). Error bars are SDs. Stars denote significant differences between the conditions (Student's unpaired t test, p<0.05).

