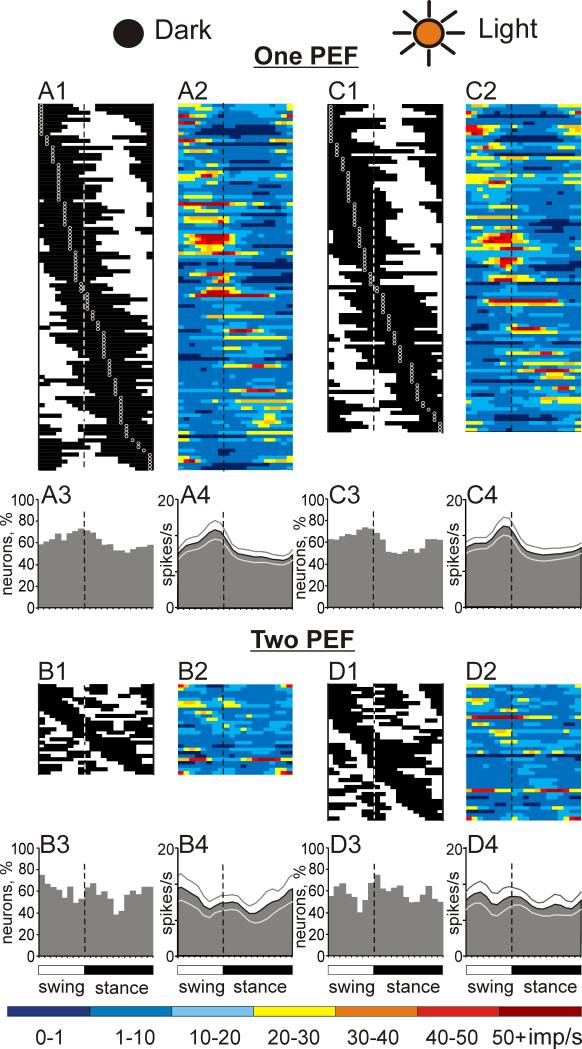
Figure 6.
Population characteristics of one- and two-PEF neurons during locomotion in the darkness and light. A1, C1: Phase distribution of PEFs of all one-PEF neurons during locomotion in the dark (A1) and under normal illumination (C1). Each row represents the PEF of one cell. A circular mark on each PEF denotes the cell's preferred phase. Neurons are rank-ordered so that those with a preferred phase earlier in the cycle are plotted on the top of the graph. Vertical interrupted lines indicate the end of swing and beginning of stance phase. A2, C2: Corresponding phase distributions of discharge frequencies. The average discharge frequency in each 1/20th portion of the cycle is color-coded according to the scale shown at the bottom of the figure. A3, C3: Proportion of active one-PEF neurons (neurons in their PEF) in different phases of the step cycle during walking in the darkness (A3) and light (C3). A4, C4: The mean discharge rate of one-PEF neurons during walking in the darkness (A4) and under normal illumination (C4). Thin lines show SEM. B1-4 and D1-4 show characteristics of two-PEF neurons locomotion in the darkness (B1-4) and light (D1-4). Designations are similar to those in A,C.

