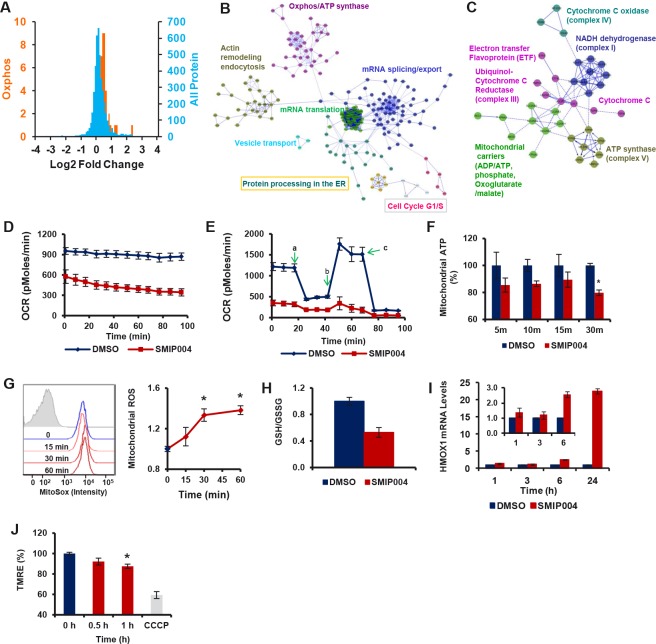
Figure 5. Effect of SMIP004 on protein expression and metabolism.
(A) The blue curve shows relative ratios of all 4421 proteins quantified by SILAC in cells treated with 40 μM SMIP004 for 3 h. 92.4% of all proteins showed a log2 ratio of ~0. The orange curve shows the ratios of 36 proteins involved in oxidative phosphorylation (Oxphos), which are significantly higher than 0. The same 36 proteins are shown in (C). (B) Reactome network built from proteins significantly upregulated by SMIP004. The network was clustered into modules, and pathways enriched in the modules (FDR ≤ 0.01) are indicated. Annotations highlighted by colored boxes refer to pathways represented by two different colors, i.e. those represented by the box frame and the font color. (C) Oxphos subnetwork clustered into individual complexes of the electron transport chain. (D) Basal oxygen consumption rate (OCR) in the presence or absence of SMIP004 in LNCaP-S14 cells was evaluated with the XF-24 Extracellular Flux Analyzer as described in Experimental Procedures. The graph represents average OCR ± SEM of three replicates. The measurements were begun (0 min time point) 10 minutes after adding vehicle or SMIP004 (40 μM) to the cells. (E) Mitochondrial respiration profile of LNCaP-S14 cells. Cells were pre-incubated for 2h with vehicle (DMSO) or SMIP004 (40 μM), followed by real-time analysis of cellular respiration in an XF24. Oligomycin (a) was added to inhibit ATP synthase, FCCP (b) to uncouple respiration from ATP synthesis, and rotenone (c) to inhibit complex I and mitochondrial respiration. The graph represents the mean oxygen consumption rate (OCR) ± SEM of three replicates. (F) LNCaP-S14 cells were treated with SMIP004 (40 μM) or DMSO in the presence of 2-deoxyglucose (2-DG) for the indicated time. 2-DG (10 mM) was added 30 min before SMIP004 to inhibit glycolytic ATP production. ATP levels were measured using the ApoSENSOR™ ATP Assay kit (BioVision). The graph represents the average ± SEM of eight replicates. * p-value: 0.00007. (G) Cells were treated with SMIP004 (40 μM) for 15, 30 or 60 minutes and mitochondrial superoxide was measured as described in Methods. The figure shows representative histograms of flow cytometry experiments demonstrating an increase in mean fluorescence intensity of oxidized MitoSox following SMIP004 treatment (filled grey histogram represents unstained cells). The graph represents the mean fold-induction ± SEM of nine replicates from three independent experiments. * p-value: 0.0001. (H) Cells were treated with SMIP004 (40 μM) for 6h and intracellular levels of reduced (GSH) and oxidized glutathione (GSSG) were determined as described in Methods. The graph shows the mean GSH/GSSG ratio ± standard deviations of three replicates. (I) HMOX1 mRNA levels were determined by qPCR in total RNA from cells treated with SMIP004 (40 μM) for the indicated time points. The graphs represent the means ± standard deviations of two independent experiments, each performed in duplicates. Data were normalized to DMSO. The inset shows blow-ups of the 1, 3, and 6h time points. (J) Cells were treated with SMIP004 (40 μM) for the indicated time points and mitochondrial membrane potential was measured as described in Methods. The graph represents the means ± SEM of two independent experiments, each performed in triplicates. * p-value: 0.0021. The mitochondrial uncoupler CCCP was used as positive control.

