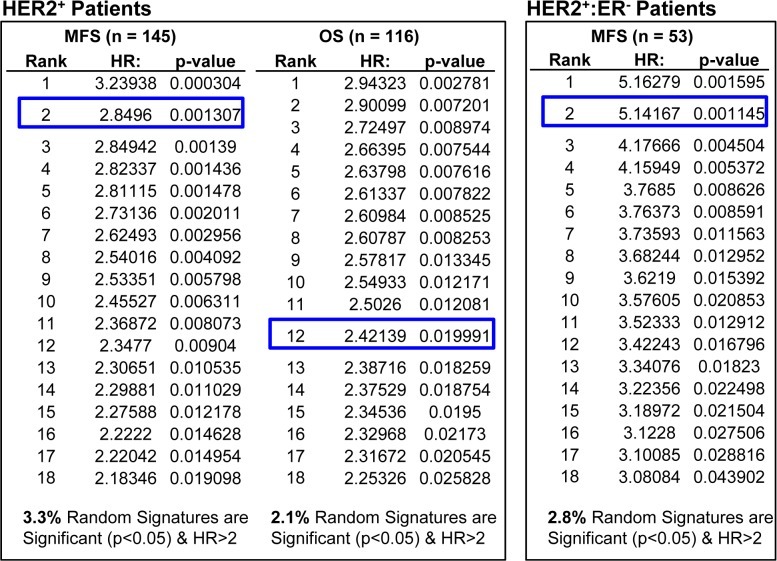
Figure 3. Comparing the prognostic power of HTICS with 1000 random sets of signatures in HER2+ breast cancer patients.
All HTICS 17 genes (8 up-regulated and 9 down-regulated) were present on both GPL570 and GPL96 platforms. Analysis was performed with 116 HER2+ patients from 2 GPL570 and GPL96 cohorts (see legends to Figure 2). A set of 1000 random signatures with the same number of genes (8 genes up-regulated, 9 down-regulated) were generated from atmosphere background noise (random.org) for OS analysis, and another for the MFS, and then SSM algorithm was employed to differentiate samples in OS and MFS cohorts. The signatures were ranked by HR and compared with HTICS (blue boxes). The % of signatures with significant HR > 2.0 is listed at the bottom. Comparing to 1000 sets of random signatures, HTICS ranked 2nd for HER2+ MFS, 12th for HER2+ OS, and 2nd for HER2+:ER− MFS.

