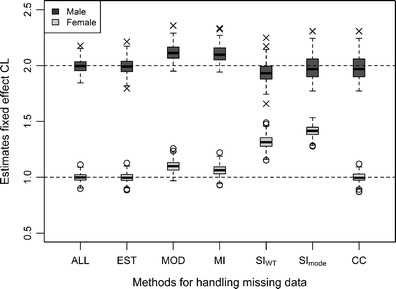
Fig. 5.

Box-plot showing bias and precision of the estimates of the typical value of CL for males (true value, 2) and females (true value, 1) after fitting 200 simulated data sets, in which the covariate sex was MNAR for 50% of the individuals, using six different methods to handle the missing data
