
Fig. 2.
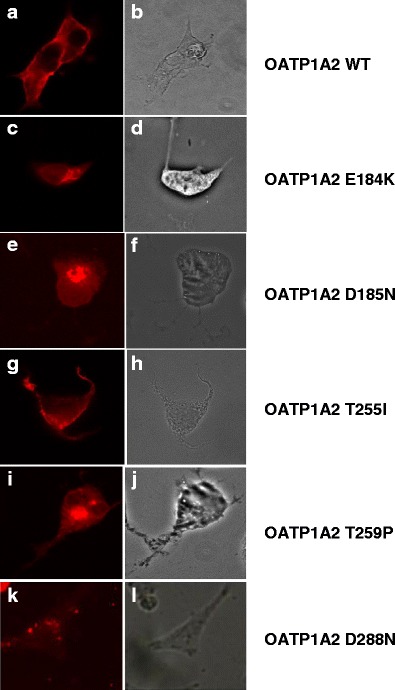
Immunofluorescence analysis of OATP1A2 and its variants expressed in HEK-293 cells. Cells that overexpressed OATP1A2 and its variants were stained with anti-OATP1A2 antibody and Alexa Fluor® 594 conjugate goat anti-rabbit IgG. Panels A, C, E, G, I, and K show the specific immunostaining of OATP1A2, which appears as bright fluorescence. Panels B, D, F, H, J, and L are phase-contrast images and show that cells remain fully attached to the culture dishes under the test conditions. WT, wild type