
Fig. 5.
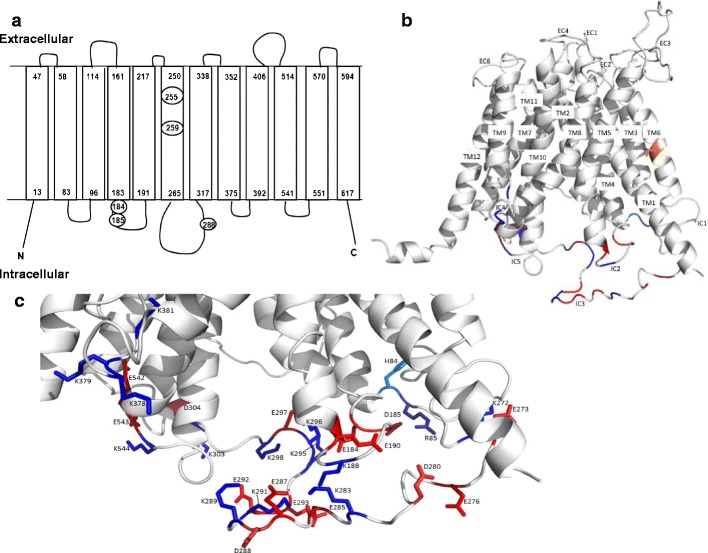
Computer modeling of OATP1A2 structure. a The topological structure of OATP1A2 obtained by Transmembrane Helix Benchmarking software (www.sydney.edu.au/pharmacy/sbio/software/TMH_benchmark) based on the structure of GlpT and shown in the same orientation. Circled residues indicate the location of the amino acid replacements in the five novel variants found in the current study. The N- and C-termini are located intracellularly, while a series of extracellular and intracellular loops connect the transmembrane domains; b proposed overall 3D structure showing transmembrane (TM) helices, extracellular (EC), and intracellular (IC) loops; and c a close up view, in the same orientation, of the intracellular region near the large loop showing the charged side chains. T259 is shown (orange) in TM6 of the helix bundle. Charged amino acids of the intracellular regions are colored blue and red for basic and acidic residues, respectively. The figures were drawn using PyMOL (DeLano Scientific; San Carlos, CA, USA)