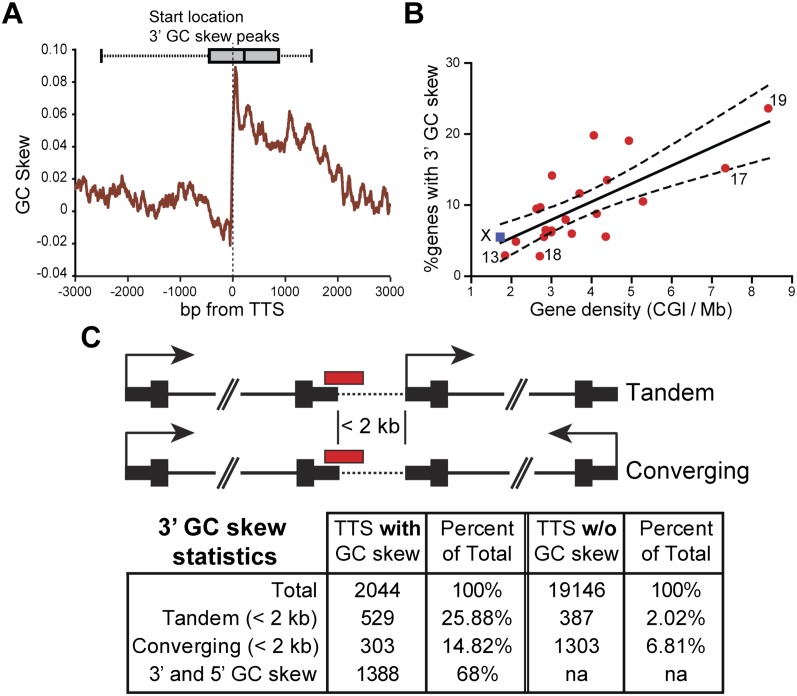
Figure 4.
Terminal GC skew is a novel feature of a subset of human genes that correlates with high gene density. (A) GC skew metaplot for genes with co-oriented terminal GC skew. The window is centered on the 3′ end of each gene (as defined by RefSeq annotation) and calculated using a 100-bp sliding window. The box whisker plot represents the distribution of GC skew peak starts. (B) Chromosomal distribution of genes with 3′ GC skew. Symbols are as in Figure 3. (C) Schematic representation of the arrangement of genes with terminal GC skew relative to their closest neighbor (focusing on neighbors located <2 kb away).

