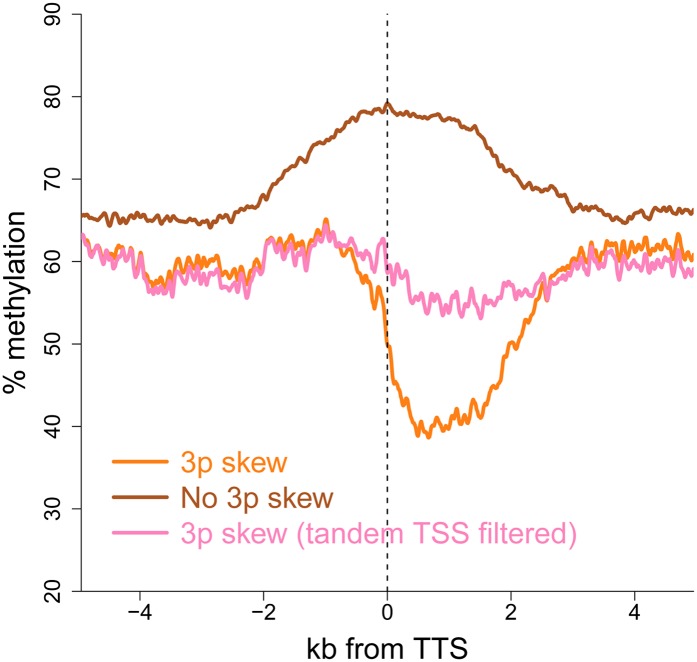
Figure 7.
Terminal GC skew also confers a measure of protection against DNA methylation. The graph represents the average DNA methylation profiles of genes with and without terminal GC skew. All genes were aligned at their TTS and DNA methylation in hESCs was from Laurent et al. (2010). Genes whose TSS was located within ≤2 kb to the nearest downstream promoter were also filtered out (tandem filter) to remove any confounding effects due to the presence of a nearby protected promoter.

