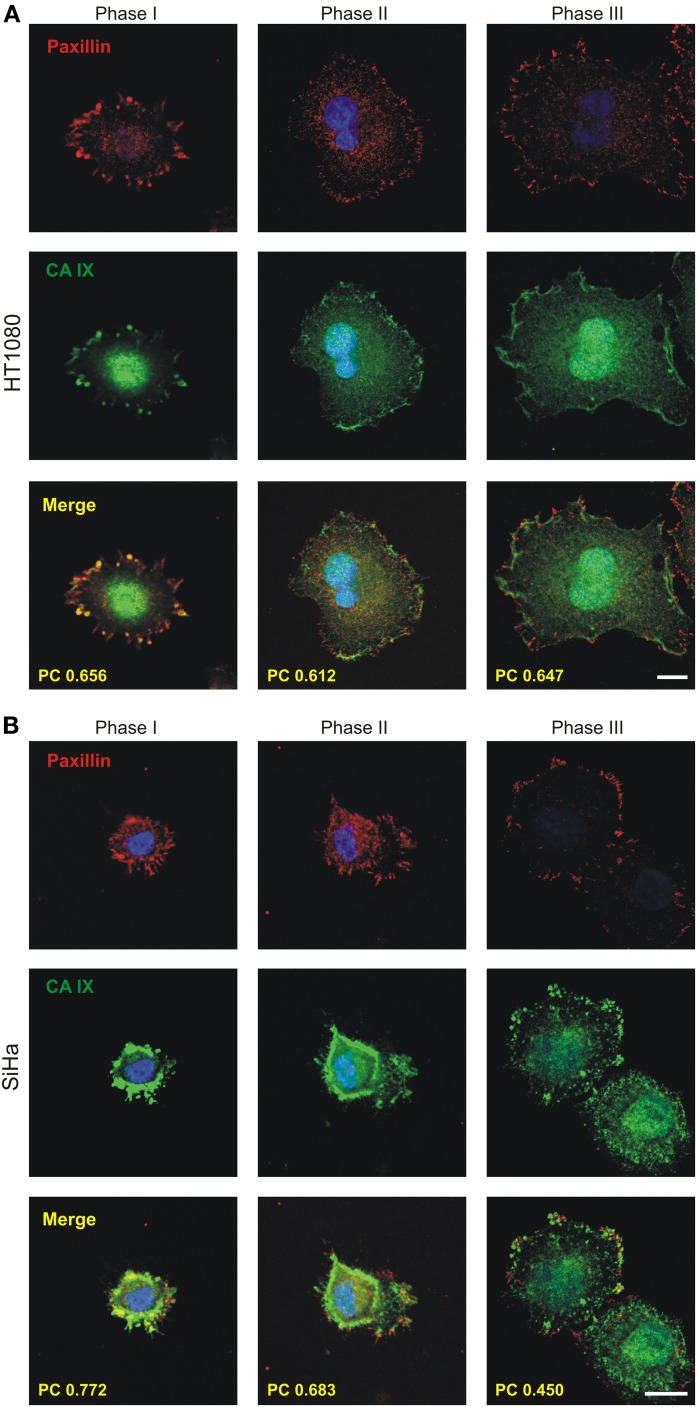
Figure 4.
Immunofluorescence analysis of the localization of CA IX during the process of initial spreading of HT1080 and SiHa cells with endogenous expression of CA IX. Cells were cultivated in hypoxia (2% O2) for 3 days, replated on collagen-coated coverslips and fixed at different times. Samples were double immunostained for CA IX (green) and paxillin (red) and imaged by confocal microscopy. Nuclear DAPI staining is blue. Phases I-III depict cells in different time points from initiation of adhesion. During phase I, shortly after cell attachment, CA IX was accumulated at the cell periphery where focal contacts had just begun to form. In phase II, soon after cells began to spread, the colocalization of CA IX and paxillin (shown in yellow) in forming focal contacts was clearly visible. In phase III (max. 2 h after seeding), characterized by spread and flattened cells, the maturating focal contacts were represented by more elongated paxillin staining with well-preserved colocalization with CA IX. Degree of colocalization between CA IX and paxillin in each phase is expressed by Pearson's coefficient (PC) in the merged images. (A) HT1080 cells (B) SiHa cells. Scale bars 10 μm.

