
Figure 2.
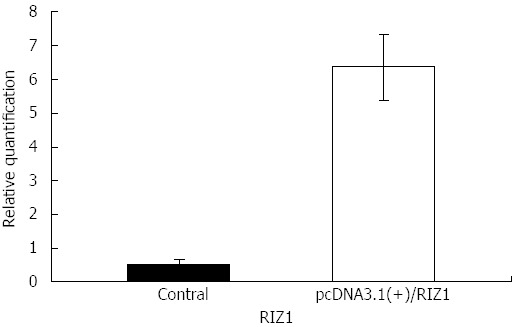
Histogram of RIZ1 gene mRNA expression levels in the blank control group and pcDNA3.1(+)/RIZ1 recombinant plasmid group, clearly showing that gene expression is higher in the pcDNA3.1(+)/RIZ1 group (P ≤ 0.01).
Official websites use .gov
A
.gov website belongs to an official
government organization in the United States.
Secure .gov websites use HTTPS
A lock (
) or https:// means you've safely
connected to the .gov website. Share sensitive
information only on official, secure websites.
Histogram of RIZ1 gene mRNA expression levels in the blank control group and pcDNA3.1(+)/RIZ1 recombinant plasmid group, clearly showing that gene expression is higher in the pcDNA3.1(+)/RIZ1 group (P ≤ 0.01).