
Figure 6.
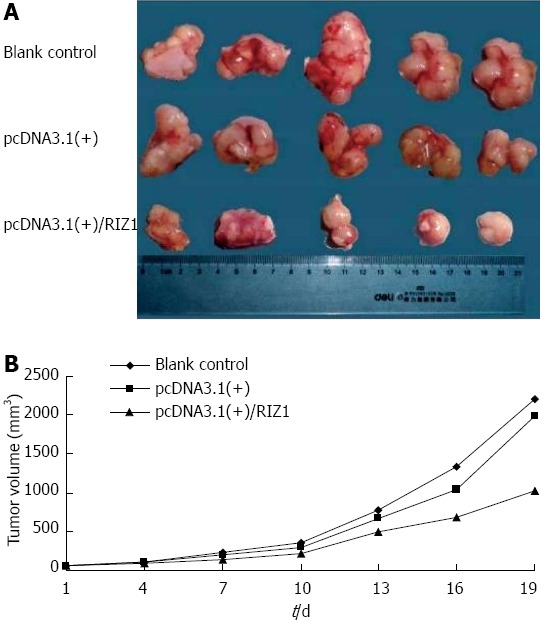
Transplantation and tumor growth. A: Photograph comparing esophageal squamous cell carcinomas removed from nude mice of the three groups after 26 d; B: Growth rate curves showing the increase in tumor volumes with time. The shallower curve in the pcDNA3.1(+)/RIZ1 group, compared to the blank control and pcDNA3.1(+) groups, indicates slower growth.