Figure 4.
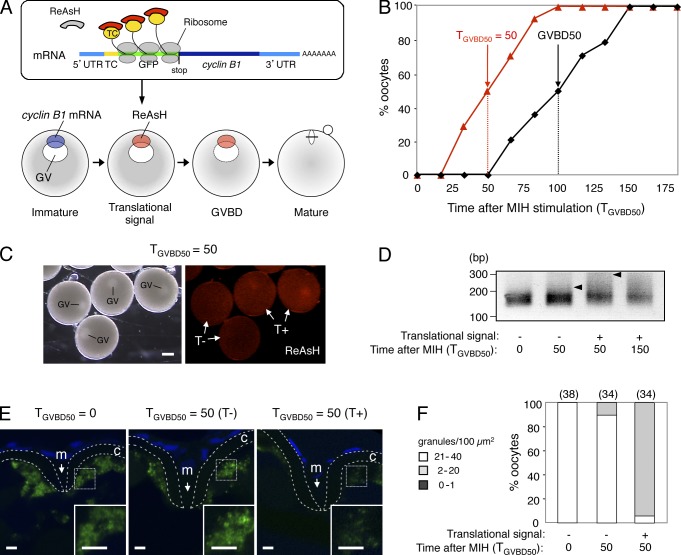
Timing of cyclin B1 RNA granule disassembly coincides with that of translational activation. (A) Schematic views for visualization of site and timing of translation during oocyte maturation. (top) The cyclin B1 reporter mRNA carries sequences encoding the TC tag (TC) and GFP downstream of cyclin B1 5′UTR. The biarsenical dye ReAsH emits no fluorescence in the absence of interaction with the TC tag. Translational activation of the reporter mRNA is visualized by binding of ReAsH to the nascent TC tag peptide, which immediately emits fluorescence. (bottom) The cyclin B1 reporter mRNA localized at the animal polar cytoplasm of an immature oocyte shows a translational signal at approximately half of the time point at which GVBD occurred. (B) Time course of translational signals (red triangles) and GVBD (black squares). (C) Translational signals at the time TGVBD50 = 50. Half of the oocytes show a translational signal (T+), whereas the remaining oocytes show no translational signal (T−). GV, germinal vesicle. Bar, 200 µm. (D) PAT assay of cyclin B1 mRNA at the time TGVBD50 = 0, 50, and 150 of the oocytes exhibiting no translational signal (−) or the oocytes exhibiting a translational signal (+). Arrowheads indicate poly(A) tails at the time TGVBD50 = 50. (E) FISH analysis of cyclin B1 mRNA (green) at the time TGVBD50 = 0 and 50 of the oocytes exhibiting no translational signal (T−) or the oocytes exhibiting a translational signal (T+). DNA is shown in blue. Insets are enlarged views of the boxed regions. Chorions are outlined by broken lines. m, micropile; c, chorion. Bars, 5 µm. (F) The number of RNA granules per 100 µm2 in individual oocytes was counted and categorized as indicated. The numbers in parentheses indicate the total number of oocytes analyzed. Similar results were obtained from three independent experiments.

