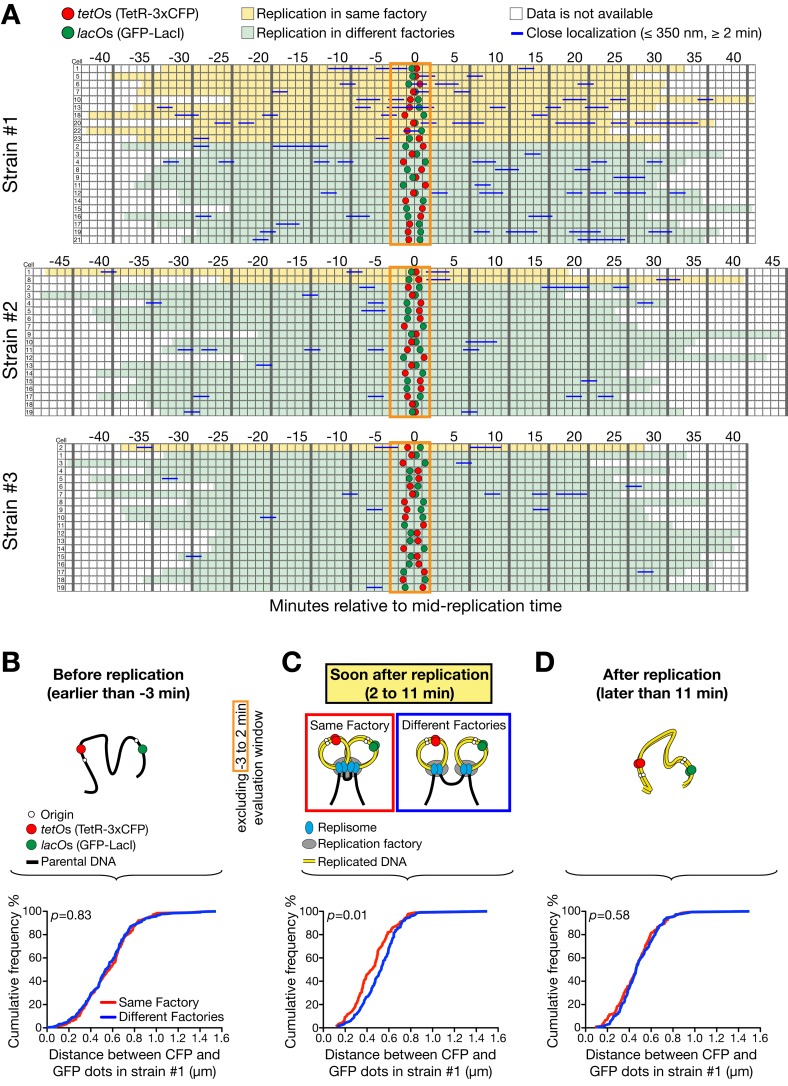
Figure 2.
Assembly of replicons for a replication factory varies from cell to cell and closer ones show more frequent assembly. (A) In each strain of #1–3 (see Fig. 1 A), 19–23 cells were analyzed as in Fig. 1, C and D, and categorized based on their two fluorescent dots being replicated at the same (yellow) or different factories (light green). 0 min was defined as in Fig. 1, C and D. Replication at the same factory was evaluated by close proximity (≤350 nm for 2 min or longer) of the dots within the time window from −3 min to +2 min (orange rectangle). (B–D) The distance between the two dots was measured at each time point in 23 cells of strain #1, as shown in A. Its distribution was then plotted as cumulative frequency, separately for replication at the same (red line) and different factories (blue line), in three time windows; i.e., (B) before replication, (C) soon after replication (excluding the time window −3 min to +2 min for the evaluation; see A), and (D) ≥11 min after replication. n (number of time points) = 190 (B, same), 254 (B, different), 87 (C, same), 117 (C, different), 140 (D, same), 182 (D, different).

