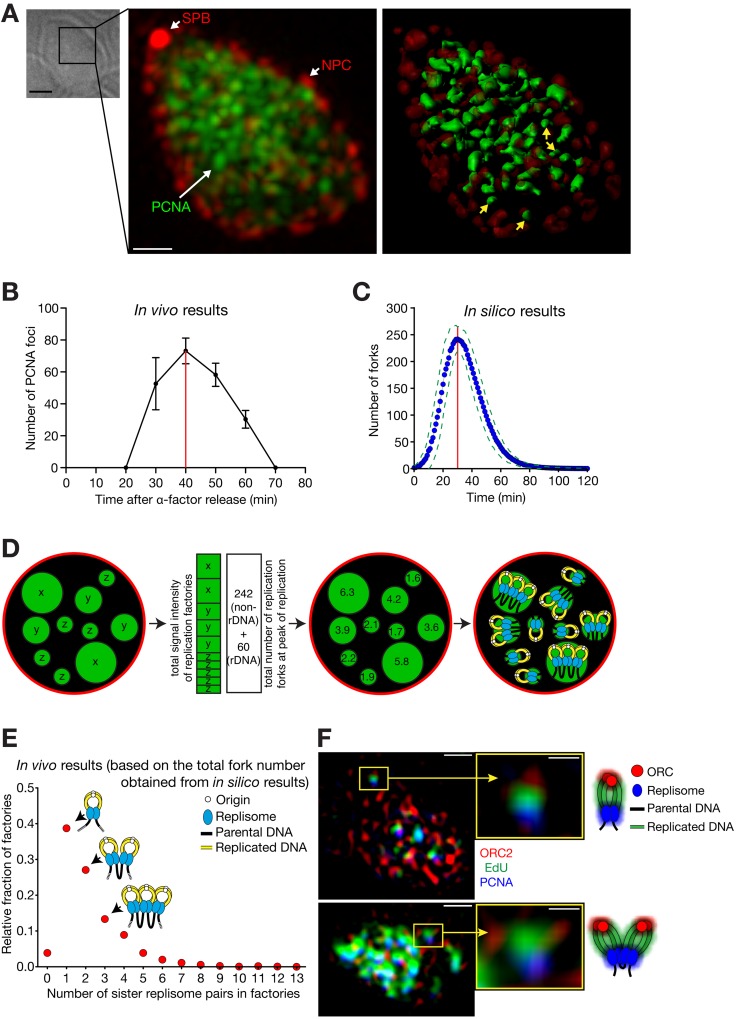
Figure 3.
Super-resolution microscopy reveals the organization of replication factories. (A and B) Replication factories observed by super-resolution microscopy. Cells (T8375) with GFP-POL30 (PCNA), SPC42-mCherry (a component of spindle pole body, SPB), and NIC96-mCherry (a component of the nuclear pore complex, NPC) were released from α-factor treatment (defined as 0 min). (A) A bright-field image, a fluorescence image (GFP, green; mCherry, red), and its 3D rendering in a representative cell, which was fixed at 40 min. Yellow arrows on the 3D rendering image indicate representative replication factories that are estimated to contain a single replisome pair (see D). Bars: (bright-field image) 2 µm; (fluorescence image) 0.5 µm. (B) The number of PCNA foci (mean ± SD) within the nucleus along the time course. Red line indicates the peak of DNA replication. (C) The number of replication forks along the time course (0 min; DNA replication initiated in 50% cells), based on the in silico analysis. The blue dots represent the mean fork numbers with 1-min intervals (green broken lines: ± SD). The number of forks reached the maximum (242 ± 24, mean ± SD) at 30 min (red line). The data did not include the forks along the rDNA region. (D) Schematic diagrams explaining how the number of replisomes (at replication forks) was estimated at each factory. This number was binned to even integers as sister replisomes associate (right; Kitamura et al., 2006). (E) Relative fractions of replication factories containing each number of sister replisome pairs. The intensities of individual replication factories were analyzed at the peak of replication (40 min in B) as explained in D, collectively in 23 cells. (F) Representative super-resolution fluorescence images, with schematic diagrams of interpretation. Cells (T8659) with TagBFP-POL30 (PCNA) and ORC2-mCherry were treated as in A. At 45 min, cells were labeled with the thymidine analogue EdU for 12 min, followed by fixation. Bars: (left) 0.5 µm; (right) 0.15 µm.

