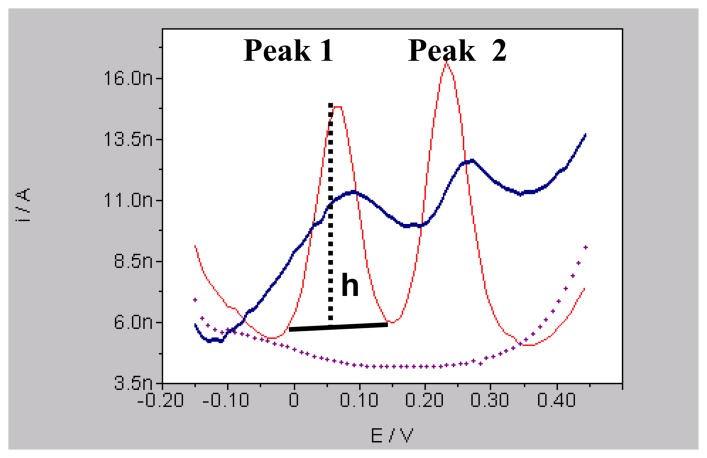
Figure 2.
In vitro and in vivo differential pulse voltammograms obtained with mCFE. Dotted line shows signals obtained in phosphate buffer solution (PBS, pH 7.4), red line shows signal for DA (Peak 1) and 5-HT (Peak 2) obtained in PBS containing at 100 nM and blue line represents in vivo signals obtained in the NAc of anaesthetised rats.; h: height of the peak, measured in nanoAmperes (I/A: Intensity of current). This perpendicular line also determined the exact potential value (E: espressed in Volts) of each signal on the abscissa.

