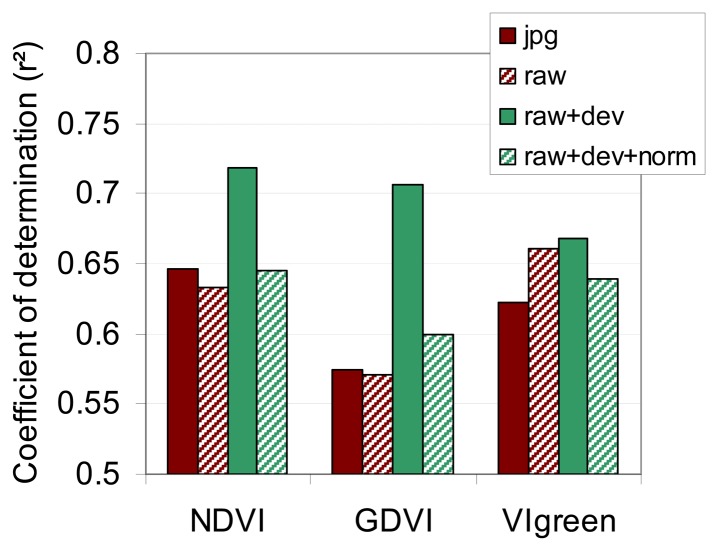
Figure 14.
Coefficient of the regression functions between CC (LAI*SPAD) and three vegetation indices (36 experimental plots across six dates). VIs are calculated from the Red, Green and NIR images at different levels of radiometric correction (jpg = JPEG format; raw = unprocessed format; dev = vignetting-corrected; norm = normalized by invariant targets).

