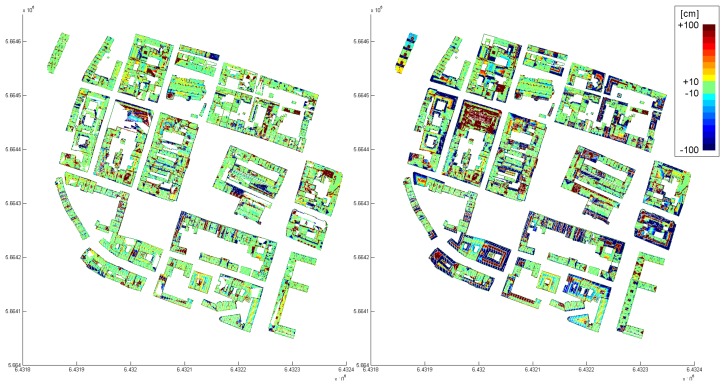
Figure 12.
Visual comparison of city models which were automatically determined from the same data set (cf. Figure 11), but by applying two different approaches (Left: proposed data driven approach; Right: model driven approach). Distances of the original points with respect to the planes defining the roof segments are shown color coded.

