
Figure 6.
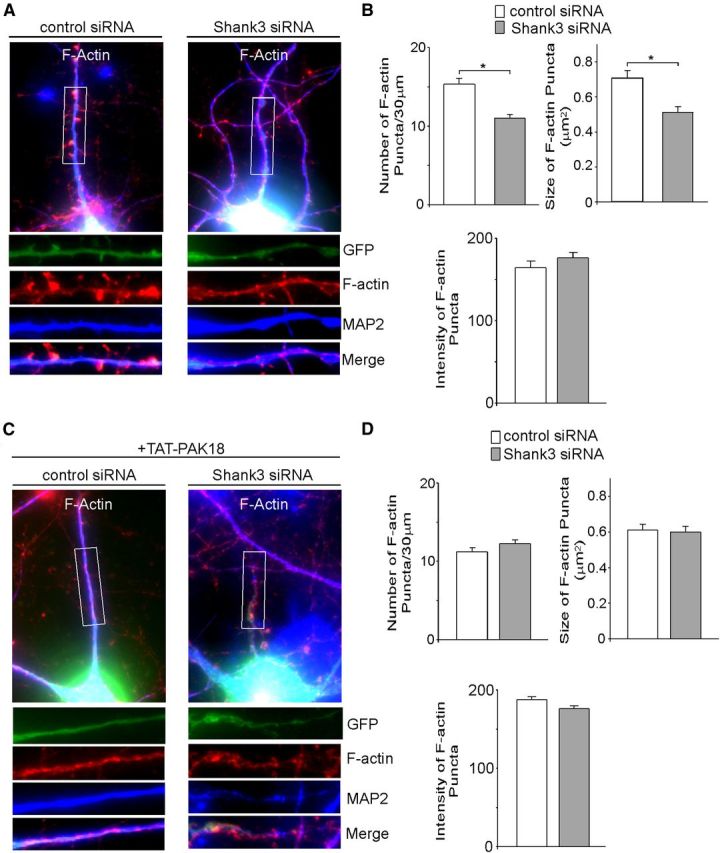
Shank3 knockdown reduces F-actin clusters, which is mimicked and occluded by PAK inhibitor. A, C, Immunostaining of F-actin (red) and MAP2 (blue) in cortical cultures (DIV 19–22) transfected with control siRNA or Shank3 siRNA (green) in the absence (A) or presence (C) of TAT-PAK18. B, D, Bar graph summary (mean ± SEM) showing the density, size, and intensity of F-actin puncta in control siRNA- or Shank3 siRNA-transfected neurons (GFP-positive) in the absence (B) or presence (D) of TAT-PAK18. *p < 0.01, t test.