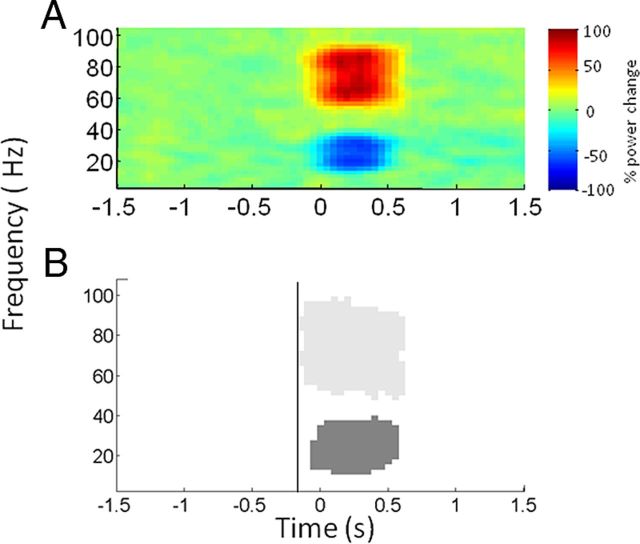
Figure 2.
Mean plots of simulated data for all subjects. A step increase and decrease in gamma and beta amplitudes of 40% respectively was simulated at 0 s lasting for 0.5 s. The resulting spectra were added to Gaussian random white noise. Power was determined relative to a 0.8 s baseline between −1.4 and −0.6 s. Each subject's image was smoothed with a 5 Hz × 500 ms Gaussian kernel, before averaging. A, Spectra of the resulting time series averaged across all subjects. B, Significant positive (light gray) and negative (dark gray) clusters of the mean responses in the gamma and beta bands, respectively. The vertical line at −150 ms indicates that statistical changes in the gamma band can be seen as early as this despite the fact that power modulations were only introduced at 0 s.

