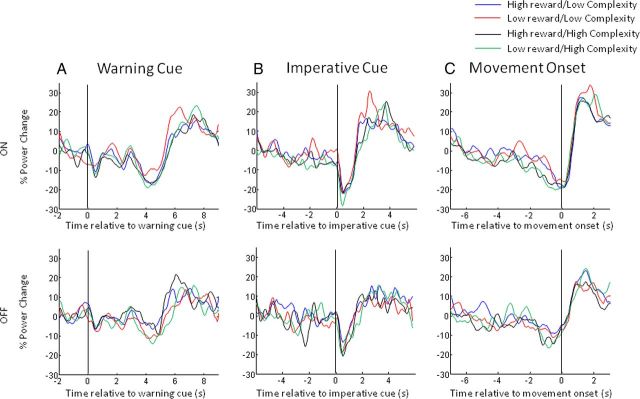
Figure 5.
A–C, Mean time series of the percentage change in beta power (15–30 Hz) aligned to the onset of the warning cue (A), the imperative cue (B), and movement onset (C) for the four different reward and trial-complexity conditions. The time series have been smoothed with a 10 point moving average and are plotted separately for the on-medication and off-medication states in the upper and lower panels, respectively. Note that movement-related beta desynchronization is greater on medication than off medication and there is a trial-complexity dependence of this effect such that high-complexity trials result in greater premovement desynchronization than low-complexity ones (C).

