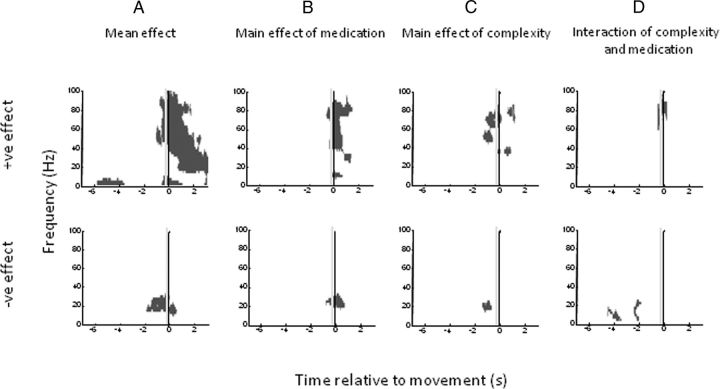
Figure 8.
Plots of significant positive (top) and negative (bottom) clusters (p < 0.01 cluster level FWE correction) for subject images aligned to movement onset. A–D, t contrasts correspond to (A) the mean overall effect across all conditions, (B) the main effect of medication, (C) the main effect of trial complexity, and (D) the interaction between trial complexity and medication. Reward and interactions with reward were not significant at the cluster level. The vertical gray line in each plot indicates −300 ms, a conservative estimate of the uncertainty in the timing of movement onset and spectral change.

