
Figure 3.
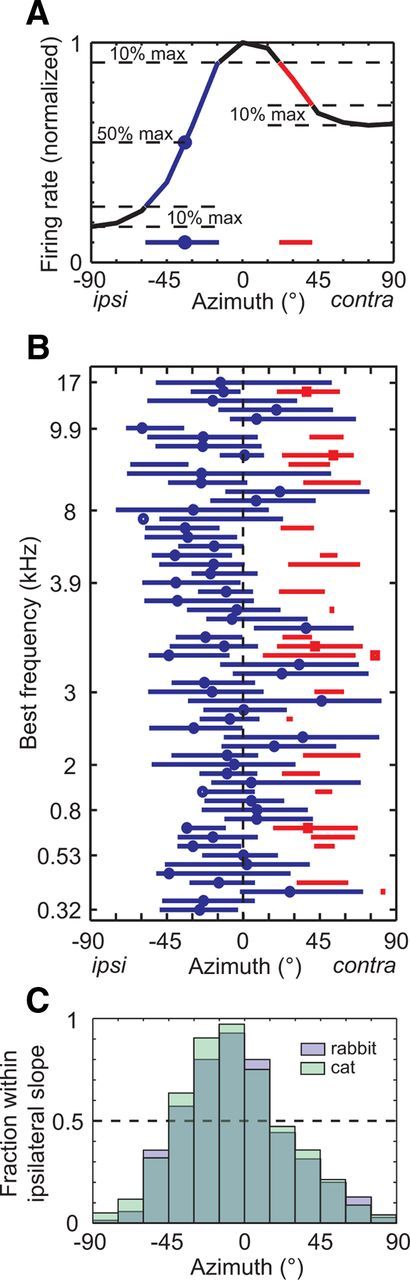
Heterogeneity of azimuth tuning functions. A, The tuning function of each azimuth-sensitive neuron was characterized by its ipsilateral slope (blue line), ipsilateral half-maximum azimuth (blue circle), contralateral slope (red line), and contralateral half-maximum azimuth (red square; none for this neuron). All features are projected onto the x-axis to show azimuth ranges. B, Features are displayed for all azimuth-sensitive neurons ordered by increasing BF (N = 59). Not shown are 11 neurons for which a BF was not measured. C, Bar graph shows the fraction of neurons that have an ipsilateral slope that overlaps with the azimuth on the x-axis (blue, N = 70). Data are also shown for IC neurons of anesthetized cats (green, N = 105; Delgutte et al., 1999). Dashed line indicates 50%.