Figure 4.

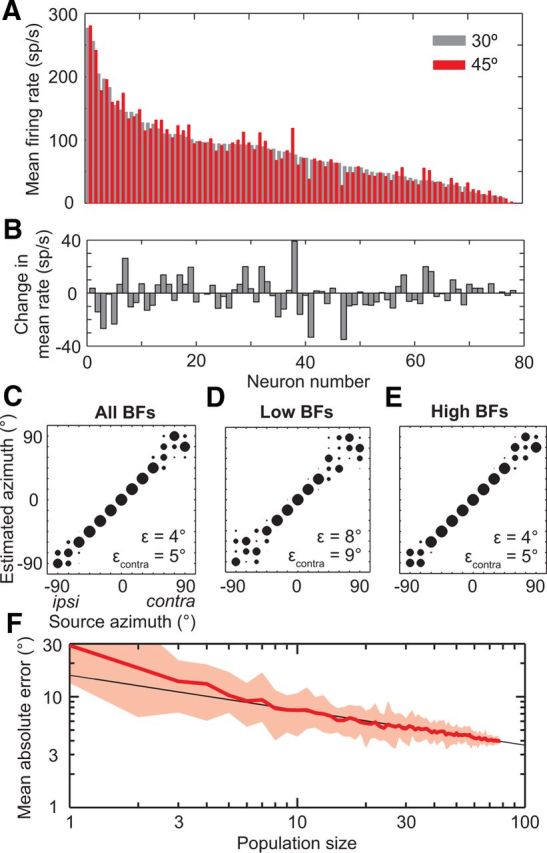
Pattern of activity across IC neurons can be used to decode source azimuth. A, Mean firing rates of all neurons to a source at 30°, ordered by decreasing rate (gray bars). Mean rates of the same neurons in the same order to a source at 45° (red bars). B, Change in mean firing rates across neurons from 30 to 45°, same order as in A. C–E, Localization performance of the population-pattern decoder using either all neurons (N = 78), neurons with low BFs (N = 21), or neurons with high BFs (N = 57), respectively. F, Mean absolute error of localization, ε, as a function of population size. Red line, mean ε over 25 randomly selected populations per size. Shaded area, range of ε. Black line, power law fit to the mean ε for sizes ≥5: y = 15.6x–0.32.
