Figure 2.
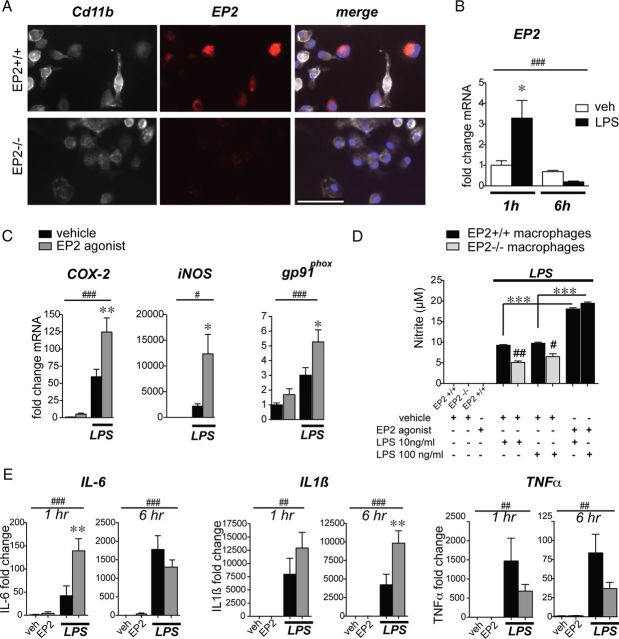
The EP2 receptor induces expression of inflammatory enzymes and cytokines in mouse peritoneal macrophages. For all panels: *p < 0.05, **p < 0.01, ***p < 0.001, values are mean ± SEM. A, EP2 immunostaining is detected in wild-type but not EP2−/− C57BL/6 primary peritoneal macrophages costained for Cd11b. Scale bar, 100 μm. B, Peritoneal macrophages were stimulated with LPS (10 ng/ml) for 1 and 6 h. qPCR demonstrates a rapid upregulation of EP2 receptor mRNA by 1 h and subsequent downregulation by 6 h following LPS stimulation (n = 4–6 per group; two-way ANOVA for effect of time ##p < 0.01, and effect of interaction p = 0.02; Bonferroni's multiple-comparison tests comparing mean of 1 h vehicle (veh) and 1 h LPS *p < 0.05). C, Peritoneal macrophages were stimulated with LPS (10 ng/ml) +/− the EP2 agonist butaprost (1 μm) or vehicle. qPCR demonstrates an induction of proinflammatory mediators COX-2, iNOS, and gp91phox with LPS stimulation that is further enhanced by costimulation with butaprost (time points 1 h for COX-2 and 6 h for iNOS and gp91phox; n = 4–6 per group; two-way ANOVA for effect of LPS #p < 0.05, ###p < 0.001; Bonferroni's multiple-comparison tests comparing means of LPS-con and LPS-butaprost *p < 0.05, **p < 0.01). D, LPS-induced macrophage NO release is increased by EP2 receptor activation with butaprost (1 μm), whereas EP2−/− macrophages show reduced NO levels compared with EP2+/+ macrophages (n = 4 per group; Student's tests #p < 0.05, ##p < 0.01 comparing EP2+/+ to EP2−/−). E, qPCR demonstrates induction of IL-6 mRNA at 1 h and IL1β mRNA at 6 h, and a trend of decreased TNFα mRNA at 6 h in LPS-stimulated macrophages with addition of butaprost (n = 4–6 per group; two-way ANOVA for effect of LPS ##p < 0.01, ###p < 0.001; Bonferroni's multiple-comparison tests comparing means of LPS-con and LPS-butaprost **p < 0.01 for IL-6 at 1 h and IL1β at 6 h).

