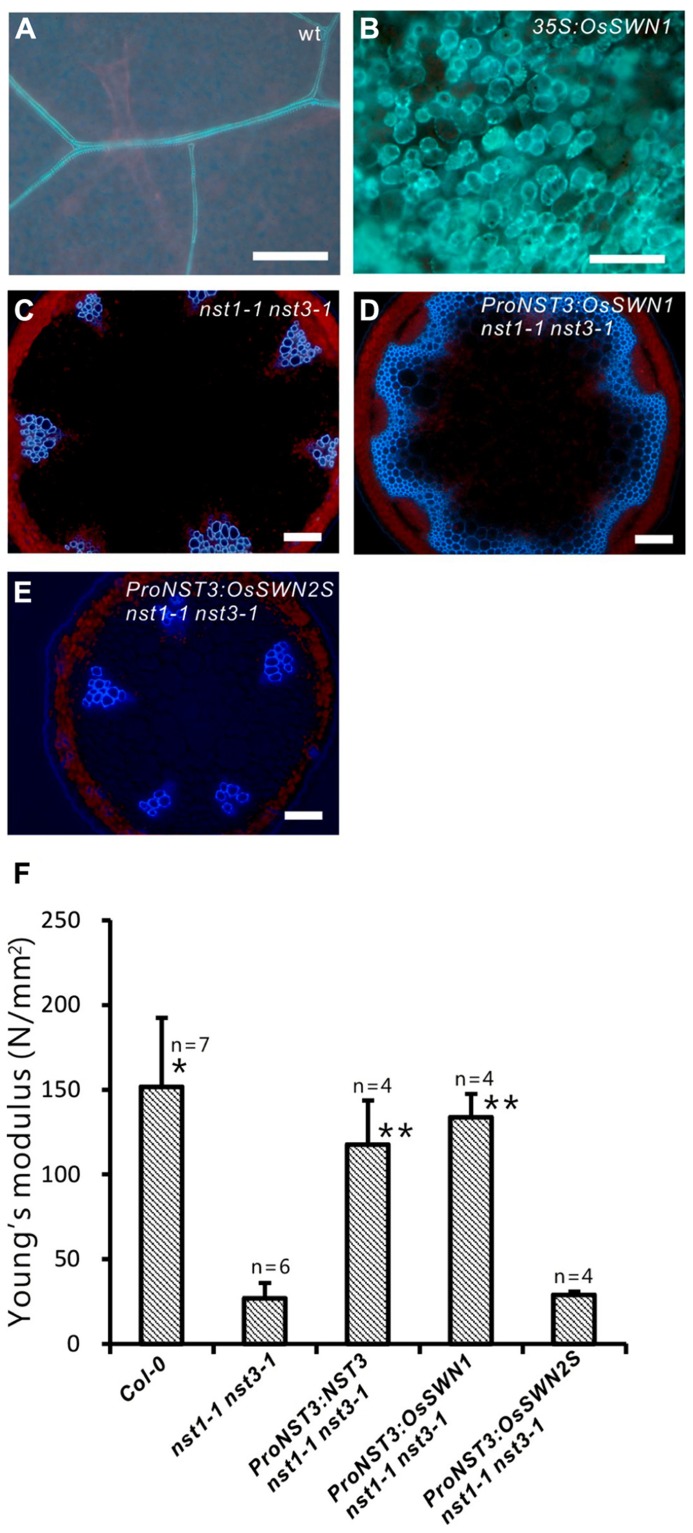
FIGURE 2.
OsSWN1 but not OsSWN2S restored the phenotype of nst1-1 nst3-1. (A–E) Fluorescence images under UV illumination. Blue auto-fluorescence represents lignin. Wild-type leaf (A), leaf of 35S:OsSWN1 Arabidopsis (B), cross section of stem of nst1-1 nst3-1 double mutant (C), nst1-1 nst3-1 ProNST3:OsSWN1 (D) and nst1-1 nst3-1 ProNST3:OsSWN2S Arabidopsis (E). Bars represent 100 μm. (F) Comparison of physical strength (Young’s modulus) of inflorescence stem. “*” and “**” indicate values significantly different from the nst1-1 nst3-1 mutant by Welch’s t-test with P < 0.05 and 0.01, respectively.

