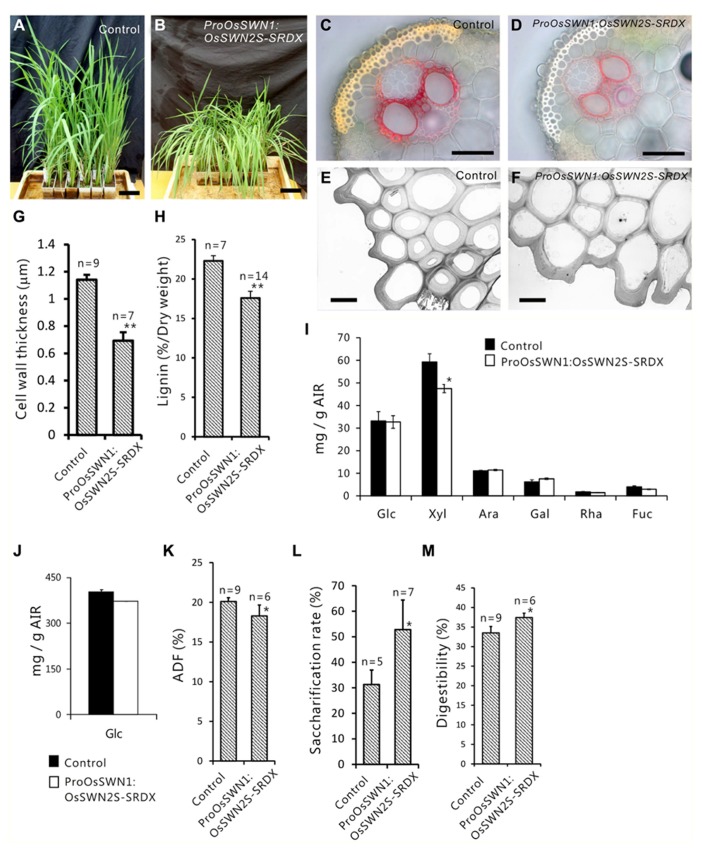
FIGURE 5.
Reduced secondary cell walls in ProOsSWN1:OsSWN2S-SRDX rice. (A) ProOsSWN1:GUS rice plants (control). (B) ProOsSWN1:OsSWN2S-SRDX rice plants. (C–F) Cross sections of leaves of control plants (C, E) and ProOsSWN1:OsSWN2S-SRDX rice plants (D, F) stained with phloroglucinol to detect lignin (C, D) or observed by transmission electron microscopy (E, F). (G, H, K–M) Thickness of secondary walls (G), lignin content (H), the ADF value (K), saccharification rate (L) and digestibility as forage (M) of ProOsSWN1:GUS rice plants (control) and ProOsSWN1:OsSWN2S-SRDX rice plants. (I, J) Cell wall sugar composition of TFA soluble fraction (I) and TFA insoluble fraction (J) in alcohol insoluble residues (AIR). Sugar composition was analyzed in AIR of ProOsSWN1:GUS [control (black, n = 5)] and ProOsSWN1:OsSWN2S-SRDX (white, n = 11). “*” and “**” indicate P value of Welch’s t-test <0.05 or 0.01, respectively. Error bars indicate SD in (G, H, K–M), SE in (I) and (J). Bars represent 10 cm in (A) and (B), 50 μm in (C) and (D), 5 μm in (E) and (F).

